- Home
-
About
-
Admissions
-
BSc (Economics) - Honours / Honours with Research
- Application Procedure
- Payment Instructions
- Fee Structure
- Important Dates
- International Students
- FAQs
- Admissions Brochure
- Webinar
-
Educational Loan
- Indian Bank
- Bank of Baroda
- Bank of Maharashtra
- Bank of India
- IDBI Bank
-
-
Academics
- BSc (Economics) - Honours / Honours with Research
- M.Sc. (Economics)
- Academic Calendar (2024-25)- M.Sc. (Economics)
- Academic Calendar (2024-25) - BSc (Economics) - Honours / Honours with Research
- Graduate Attributes
- Programme Outcomes- BSc (Economics) - Honours / Honours with Research
- Programme Outcomes-M.Sc (Economics)
- BSc (Economics) - Honours / Honours with Research - Stakeholder Feedback
- MSc(Economics) - Stakeholder Feedback
- Ph.D - Stakeholder Feedback
- Academic Bank of Credits
- Examinations
-
Students
-
Student Council
- B.Sc. Council Members
- M.Sc. Council Members
- Sports Council
-
Clubs & Associations
- Club Overview
- Activities
- Entrepreneurship Cell
- Gender cell
- Arthniti
- ISR Activities
-
- Internationalization
- Events
-
Placements
- Conference
- Transforming India 2030: Strategies For Sustainable Development Goals (TISSDG)
- NABARD - National Conference 2019 - Transforming Rural India 2030: Strategies for Sustainable Development Goals
- Future of Employment: Challenges and Opportunities (FECO) - 2019
- Future Of Employment: Challenges And Opportunities (FECO) - 2023
- Research
- Infrastructure
- Contact
- Health Promoting University
Centre for Quantitative Learning and Applications - SSE Centre for Quantitative Learning and Applications
Home Research Centre for Quantitative Learning and Applications
Centre for Quantitative Learning and Applications
About
The Center for Quantitative Learning and Application at Symbiosis School of Economics is dedicated to advancing the frontiers of quantitative knowledge in economics. Established on the pillars of academic excellence, research impact, and practical application, the center aims to shape the next generation of economists and analysts.
VISION:
To be a pioneering hub for quantitative excellence, driving innovation, and fostering a deep understanding of economic phenomena through cutting-edge research and application.
- Centralized Access to Quantitative Learning Resources: Facilitate seamless access to a comprehensive repository of materials on quantitative learning, consolidating valuable resources at a centralized hub for the benefit of students.
- Interactive Learning Through Periodic Code Blogs: Enhance student engagement by regularly publishing blogs containing codes for data extraction and analysis, catering specifically to their dissertation requirements and promoting interactive learning experiences.
- Timely Updates on Data Releases with Insightful Commentary: Keep CQLA users informed about the latest data releases by providing timely updates accompanied by concise commentaries, ensuring a well-rounded understanding of the findings.
- Supportive Guidance for Students Facing Quant Challenges: Extend a supportive hand to students grappling with challenges related to modeling, data, or other quantitative aspects in their dissertations, offering assistance and guidance to foster their academic success.
MISSION:
- Advanced Quantitative Education: Provide rigorous and contemporary education in quantitative methods, econometrics, and data science to empower students with the skills necessary for analytical decision-making.
- Interdisciplinary Collaboration: Foster a collaborative environment that encourages interdisciplinary research, bringing together experts from economics, mathematics, computer science, and other relevant fields to address complex societal challenges.
- Applied Research Impact: Conduct impactful research at the intersection of quantitative methods and economics, translating theoretical insights into practical solutions with real-world applications.
- Industry Engagement: Establish strong ties with industry partners to facilitate internships, projects, and collaborations, ensuring that our students gain practical experience and exposure to current industry practices.
- Global Outreach: Engage in international partnerships and collaborations to stay at the forefront of global developments in quantitative economics, promoting cross-cultural exchange and learning.
- Ethical Data Use: Instill a commitment to ethical practices in data collection, analysis, and application, emphasizing the responsible use of quantitative methods for the betterment of society.
Key Features:
- Comprehensive Curriculum: Our programs offer a comprehensive curriculum that blends theoretical knowledge with hands-on experience in quantitative methods, econometrics, and data science.
- Cutting-edge Research: The center is committed to conducting high-impact research that addresses contemporary economic challenges, with a focus on practical solutions and applications.
- Industry Integration: Through strategic partnerships with industry leaders, students have the opportunity to apply their quantitative skills in real-world scenarios, preparing them for successful careers in various sectors.
- Global Perspective: We embrace a global perspective, encouraging international collaborations, research exchange programs, and a diverse student body to enrich the learning experience.
- Ethical Practices: Upholding the highest standards of ethics in quantitative research and data application, we instill in our students a strong sense of responsibility in using their skills for the greater good.
Team
Director’s Message
Welcome to the Centre for Quantitative Learning and Application (CQLA) at Symbiosis School of Economics!
Explore the Centre for Quantitative Learning and Application – your gateway to a wealth of data that will create new knowledge! We are committed to advancing learning through data dissemination and open codes, promoting transparency and empowering our community with accessible resources. Join us in unlocking the potential of quantitative learning for a future of informed decision-making and collaborative innovation.
I am delighted to extend a warm welcome to the Centre for Quantitative Learning and Application at Symbiosis School of Economics, Pune. It brings me great pleasure to introduce this innovative initiative, aimed at fostering a culture of data collation and sharing, quantitative excellence and application within our academic community.
In an era characterized by the rapid evolution of technology and data, the ability to navigate, analyse, and draw insights from quantitative information is more crucial than ever. CQLA is dedicated to equipping our students with the skills and knowledge necessary to thrive in this data-driven world.
Our centre is committed to providing a dynamic and supportive environment where students can engage with quantitative concepts, methodologies, and applications across various disciplines. Through a combination of rigorous coursework, hands-on projects, and collaborative research opportunities, we aim to empower our students to become adept problem solvers and critical thinkers.
At the Centre for Quantitative Learning and Application, we recognize the importance of bridging the gap between theory and practice. We are actively cultivating partnerships with industry leaders, research institutions, and experts in the field to ensure that our students gain real-world exposure and practical insights that will set them apart in their future endeavours.
I encourage all students, faculty, and staff to embrace the opportunities offered by the Centre for Quantitative Learning and Application. Whether you are a seasoned expert seeking to enhance your quantitative skills or a newcomer eager to explore the world of data-driven decision-making, our centre provides a platform for continuous learning and growth.
As we embark on this exciting journey together, I am confident that the Centre will play a pivotal role in shaping the future of our students and contributing to the advancement of knowledge in the field of quantitative sciences.
I look forward to witnessing the accomplishments and successes that will undoubtedly emerge as an outcome of our association with varied stakeholders, helping us enhance our research and offer consultancy services
Warm regards,
Dr. Jyoti Chandiramani
Director,
Symbiosis School of Economics &
Dean Faculty of Humanities and Social Sciences
Team members
Dr Nawazuddin Ahmed,
Head (CQLA)
Assistant Professor (Economics), SSE, SIU
Dr Sudipa Majumdar,
Member (CQLA)
Senior Fellow
Dr Ranjan Kumar Dash,
Member (CQLA)
Associate Professor (Economics), SSE, SIU
Mr. Shailesh Bharati,
Member (CQLA)
Adjunct Faculty (Economics), SSE, SIU
Contact Us
Repository
Important Data Sources
- Epidemic-Macro Model Data Base https://www.epi-mmb.com/
- World Bank: Poverty and Inequality Platform https://pip.worldbank.org/home
- Large-scale, cross-national, probability-based web panel: Published by the European Social Survey (ESS) bit.ly/3PLSidn
- World Bank: World Development Indicators https://databank.worldbank.org/source/world-development-indicators
- Open Government Data (OGD) Platform India https://data.gov.in/
- Ministry of Statistics and Programme Implementation: National Accounts Data https://www.mospi.gov.in/data
- Ministry of Statistics and Programme Implementation: Microlevel Data (NSO, ASI, PLFS, Economic Census, Employment and Unemployment, etc) http://microdata.gov.in/nada43/index.php/catalog/central/about
E-Books
- London School of Economics https://press.lse.ac.uk/site/books/
- Openstax: The future of education https://openstax.org/subjects/social-sciences
- National Digital Library of India https://ndl.iitkgp.ac.in/
- Directory of Open Access Books https://doabooks.org/
- OAPEN: Online library and publication platform https://www.oapen.org/home
- Project Gutenberg https://www.gutenberg.org/
- World Bank Book Repository https://openknowledge.worldbank.org/
- Internet Archive: Digital Library https://archive.org/
Important Discussion and Working Paper Series
- The Centre for Economic Policy Research (CEPR) https://cepr.org/publications/discussion-papers
- The IZA – Institute of Labor Economics https://www.iza.org/publications/dp
- NBER https://www.nber.org/papers?page=1&perPage=50&sortBy=public_date
- NATIONAL COUNCIL OF APPLIED ECONOMIC RESEARCH https://www.ncaer.org/publication-category/working-papers
- Asian Development Bank https://www.adb.org/publications/series/economics-working-papers
- Repec Working Paper Repository https://econpapers.repec.org/paper/
- OECD https://www.oecd.org/economy/economicsdepartmentworkingpapers.htm
Latest AI Tools
- The Ultimate Chatgpt Browser Extension: http://Alicent.ai
- Create Designs: http://Stockimg.ai
- Code Writer – BlackBox: https://www.useblackbox.io/
- Video Creator – HeyGen: https://www.heygen.com/
- Presentations - Decktopus AI: https://www.decktopus.com/
- Search Engine - Franks AI: https://franks.ai/
- AI Business Strategist – Vizologi: https://vizologi.com/
- Emails: https://inboxpro.io
- Online Meetings: https://tldv.io
- Chat with PDF: http://chatpdf.com
- Create Designs: https://stockimg.ai
- Scan GitHub Repositories:
- Discover The Newest AI Tools - AI Valley: http://aivalley.ai
- Create AI videos from just text - Elai: http://elai.io
- Take Your Meeting Notes - tldv: http://tldv.io
Free Online Courses
- Computer Science https://pll.harvard.edu/course/cs50-introduction-computer-science?delta=0%E2%80%A6
- Programming with Scratch https://pll.harvard.edu/course/cs50s-introduction-programming-scratch?delta=0%E2%80%A6
- Web Programming with Python and JavaScript https://pll.harvard.edu/course/cs50s-web-programming-python-and-javascript?delta=0…
- Artificial Intelligence https://pll.harvard.edu/course/cs50s-introduction-artificial-intelligence-python?delta=0…
- Programming with Python https://www.edx.org/learn/python/harvard-university-cs50-s-introduction-to-programming-with-python
- Mobile App Development with React Native https://pll.harvard.edu/course/cs50s-mobile-app-development-react-native?delta=0%E2%80%A6
- Introduction to Data Science with Python https://pll.harvard.edu/course/introduction-data-science-python?delta=0%E2%80%A6
- Introduction to Game Development https://pll.harvard.edu/course/cs50s-introduction-game-development?delta=0
- Mathematics For Computer Science https://ocw.mit.edu/courses/6-042j-mathematics-for-computer-science-spring-2015/
- Introduction to Machine Learning https://ocw.mit.edu/courses/6-036-introduction-to-machine-learning-fall-2020/
Updates in Economics (Events, Calls for Papers, Conferences and Opportunities)
- Economics Network https://economicsnetwork.ac.uk/
- IHDS Monthly Update https://ihds.umd.edu/publications-and-research/monthly-forum-newsletter
- NCAER Monthly Review of the Economy https://www.ncaer.org/newsletter-category/monthly-review-of-the-economy
- CRISIL Economy First Cut https://www.crisil.com/en/home/our-analysis/views-and-commentaries.html
Urban Corner
- MIT: Mapping Cities https://news.mit.edu/2023/mapping-cities-motion-book-0613
- Book Announcement
The Middle Class in Neo-Urban India: Space, Class and Distinction By Smriti Singh https://www.routledge.com/The-Middle-Class-in-Neo-Urban-India-Space-Class-and-Distinction/Singh/p/book/9781032248370 - Open City: Urban Data Portal https://opencity.in/
Learn Data: Websites and Blogs
- https://alberts-newsletter.beehiiv.com/
- Curve fitting in R:https://finnstats.com/index.php/2022/04/02/curve-fitting-in-r/?utm_source=ReviveOldPost&utm_medium=social&utm_campaign=ReviveOldPost
- For Learning R:https://rfortherestofus.com/
- R News and Tutorials:https://www.r-bloggers.com/
Data and Econometric Notes
- TIME SERIES ANALYSIS: Alexander Aue, University of California, Davis https://t.co/BnxeEN4IBd
- Stanford University open source econometrics notes https://web.stanford.edu/~doubleh/eco270/
- Introduction to cleaning data with R https://pyoflife.com/introduction-to-cleaning-data-with-r-pdf/
Coding and Data: E-Books
- The Python Workbook https://pyoflife.com/the-python-workbook-pdf/
- Qualitative Data Analysis https://researchdesignreview.com/2020/05/07/qualitative-data-analysis-16-articles-on-process-method/
- Data Science for Economics and Finance: Sergio Consoli, Diego Reforgiato Recupero and Michaela Saisana (Editors) https://link.springer.com/content/pdf/10.1007/978-3-030-66891-4.pdf
Softwares
- Gretl
- R
- PSPP
Blogs
Working with World Development Indicators (WDI) from the World Bank Databank
Nawazuddin Ahmed | 25 December 2023 | Stata, WDI
If you intend to utilize data from the 'World Development Indicator (WDI),' the provided codes will be beneficial for your use. I have specifically extracted data for chosen countries, and you have the flexibility to modify the country names. All indicators from the WDI are included in this extraction. You can opt to work with a subset of indicators by removing unnecessary data. I recommend organizing the data initially and subsequently eliminating the indicators that are not required.
Dr. Nawazuddin Ahmed
Assistant Professor (Economics)
Head, Centre for Quantitative Learning and Application (CQLA)
Symbiosis School of Economics, Pune
(Department of Symbiosis International (Deemed University))
Re-Accredited by NAAC with ‘A++’ Grade
**The following codes are case-sensitive from this point onward. I suggest copying all the codes and pasting them into a do file.
**Change Directory
cd "F:\Hard_Drive_Toshiba\CQLA" //Give your own directory name
dir
dir *xlsx
**Import Excel
import excel " F:\Hard_Drive_Toshiba\CQLA \WDI_BRICS_all_inicators", sheet("Data") firstrow clear
**Select some countries. Here BRICS for example
keep if CountryCode=="BRA" | CountryCode=="IND" | CountryCode=="CHN" | CountryCode=="ZAF" | CountryCode=="RUS"
tab CountryName //see country names
gen n=_n
br
keep if _n<=7390 //remove if there are extra rows
**Convert data in the long format
reshape long YR, i( CountryName SeriesName ) j(year)
br
ren YR value
gen newv1=1 if CountryCode=="BRA"
replace newv1=2 if CountryCode=="RUS"
replace newv1=3 if CountryCode=="IND"
replace newv1=4 if CountryCode=="CHN"
replace newv1=5 if CountryCode=="ZAF"
sort newv1 SeriesName year
by newv1 SeriesName: gen Y_n=_n
egen id=concat(newv1 Y_n)
sort SeriesName
drop n
gen n=_n
tab SeriesName
mata 465570/315 //total obs./series freq.
xtile series_code = n , nq(1478)
sort newv1 SeriesName year
save WDI_BRICS_all_indicators
drop SeriesName
**The follwoing command will take some time
forvalues i = 1/1478 {
preserve
keep if series_code == `i'
ren value value_`i'
save "series_`i'.dta", replace
restore
}
**This too will take some time
use "series_1.dta", clear
forval i = 2/1478 {
merge 1:1 id using "series_`i'", nogen
save WDI_BRICS_all_indi_values.dta
***Replace .. with . as missing values
forval i= 1/1478 {
replace value_`i'="." if value_`i'==".."
}
**Delete the series_`i'.dta files
!del *series*.dta
destring value_*,replace
**Your data is ready. Now you can choose some indicators for analysis. For Example
keep value_1201 value_1444 value_1381 value_671 value_1174 value_138 value_137 value_139 value_543 value_474 value_477 value_318 value_389 value_987 value_1207 CountryName year Y_n id n series_code
label var value_1201 "Renewable energy consumption (% of total final energy consumption)"
label var value_1444 "Urban population (% of total)"
label var value_1381 "Total natural resources rents (% of GDP)"
label var value_671 "Investment in energy with private participation (current US$)"
label var value_1174 "Public private partnerships investment in energy (current US$) "
label var value_138 "CO2 emissions (kt) "
label var value_137 "CO2 emissions (kg per PPP $ of GDP)"
label var value_139 "CO2 emissions (metric tons per capita)"
label var value_543 "Gross fixed capital formation (% of GDP)"
label var value_474 "GDP (current US$)"
label var value_477 "GDP growth (annual %)"
label var value_318 "Domestic credit to private sector by banks (% of GDP)"
label var value_389 "Energy intensity level of primary energy (MJ/$2017 PPP GDP)"
label var value_987 "Patent applications, residents"
label var value_1207 "Research and development expenditure (% of GDP)"
save,replace
Creating Rotational Panels from Periodic Labour Force Survey (PLFS) Rounds
Nawazuddin Ahmed | 25 December 2023 | Employment, PLFS, Rotational Panel, Stata Codes
The blog contains STATA codes for creating rotational panels from the Periodic Labour Force Survey (PLFS) rounds. The initial PLFS took place in 2017-18, and since then, a new PLFS round has been conducted every year. The PLFS introduced a rotational panel system, where a panel retires after four quarters, and a new one is introduced (onlyfor urban areas). Consequently, an urban household is interviewed for four consecutive quarters. This type of data is most suitable for analyzing mobility, change, or transitions.
As mentioned in the code, we can directly start creating rotational panels by combining visit-wise data (keeping in mind that there are four visits to each sample household). The alternative is to first identify panels in each survey round, then append all panels, and finally, create visit-wise files. I have chosen the second route (which is a bit lengthy) because, firstly, I wanted to create a panel in each round. Additionally, there is an issue with the unique identification of households in the 2017-18 and 2018-19 data. The households interviewed in 2017-18 were reinterviewed in 2018-19 (panels P12, P13, and P14). However, the unique identification IDs in these two rounds differ significantly. This problem was identified by Abdul-Razak, S., & Sahoo, S. (2021). That's why in the codes, I have only combined panels from 2018-19 with panels from 2019-20.
These codes were created in 2021, and since then, there have been more PLFS rounds. If you're interested, you can create more rotational panels. I have run the codes before writing this blog, and to the best of my knowledge, these codes are error-free. Feel free to reach out to me for feedback or if you encounter any errors.
Dr. Nawazuddin Ahmed
Assistant Professor (Economics)
Head, Centre for Quantitative Learning and Application (CQLA)
Symbiosis School of Economics, Pune
(Department of Symbiosis International (Deemed University))
Re-Accredited by NAAC with ‘A++’ Grade
**The following codes are case-sensitive from this point onward. I suggest copying all the codes and pasting them into a do file.
**********************PLFS-2017-18*********************
cd "D:\Hard Drive\toshiba_PLFS\2017_18" //Give your own directory name
infile using "D:\Hard Drive\toshiba_PLFS\2017_18\HHFV.dct",clear
isid fsu samplesbno sssno shno
gen hhid=fsu+samplesbno+sssno+shno
bysort hhid: gen dup=cond(_N==1, 0, _n)
save hh_fv_17_18
infile using "D:\Hard Drive\toshiba_PLFS\2017_18\HHRV.dct",clear
isid fsu samplesbno sssno shno
gen hhid=fsu+samplesbno+sssno+shno
bysort hhid: gen dup=cond(_N==1, 0, _n)
save hh_rv_17_18
infile using "D:\Hard Drive\toshiba_PLFS\2017_18\PERFV.dct",clear
isid fsu samplesbno sssno shno prsn_srl
gen hhid=fsu+samplesbno+sssno+shno
gen psid=hhid+prsn_srl
save per_fv_17_18
infile using "D:\Hard Drive\toshiba_PLFS\2017_18\PERRV.dct",clear
isid fsu samplesbno sssno shno prsn_srl
gen hhid=fsu+samplesbno+sssno+shno
gen psid=hhid+prsn_srl
save per_rv_17_18
use hh_fv_17_18,clear
merge 1:m hhid using per_fv_17_18
drop _merge
save hhind_fv_17_18
use hh_rv_17_18,clear
merge 1:m hhid visit using per_rv_17_18
drop _merge
save hhind_rv_17_18
*______Making Rotational Panel_1_______*
use hhind_fv_17_18,clear //First Visit HH and Individual Merged File
gen panelid="P11" if quartr=="Q1" //Create Panel id
replace panelid="P12" if quartr=="Q2"
replace panelid="P13" if quartr=="Q3"
replace panelid="P14" if quartr=="Q4"
**Give Prefix to all variables: 'fv' stands for first visit
foreach x of var * {
rename `x' fv_`x'
}
**However, for merging remove prefix from the following variables
ren (fv_hhid fv_psid fv_panelid) (hhid psid panelid)
**since rotational panel is only for urban areas, keep urban data only**
keep if fv_sect=="2"
save fv_17_18
use hhind_rv_17_18,clear //Revisit HH and Individual Merged File
gen panelid="P11" if quartr=="Q2" & visit=="V2" //Create Panel Ids as we did in 'first visit' file
replace panelid="P11" if quartr=="Q3" & visit=="V3"
replace panelid="P11" if quartr=="Q4" & visit=="V4"
replace panelid="P12" if quartr=="Q3" & visit=="V2"
replace panelid="P12" if quartr=="Q4" & visit=="V3"
replace panelid="P13" if quartr=="Q4" & visit=="V2"
***Now give prefix to variables 'rv' for revisit
foreach x of var * {
rename `x' rv_`x'
}
***Again, remove prefix from some variables
ren (rv_hhid rv_psid rv_panelid) (hhid psid panelid)
save rv_17_18 //save as revisit file
***Merge first visit and revisit file
use fv_17_18,clear
merge 1:m panelid psid using rv_17_18
***Don't run: it's output
Result # of obs.
not matched 51,386
from master 49,416 (_merge==1)
from using 1,970 (_merge==2)
matched 270,590 (_merge==3)
***************
save rotational_1_17_18 //this is first rotational panel
************Repeat same with 2018-19 with some additional steps**************************
**************2018-2019***********************
cd "F:\toshiba_PLFS\2018_19"
infile using "F:\toshiba_PLFS\2018_19\HHfv_18_19.dct",clear
isid fsu samplesbno sssno shno
gen hhid=fsu+samplesbno+sssno+shno
bysort hhid: gen dup=cond(_N==1, 0, _n)
save hh_fv_18_19
infile using "F:\toshiba_PLFS\2018_19\HHrv_18_19.dct",clear
isid fsu samplesbno sssno shno
gen hhid=fsu+samplesbno+sssno+shno
bysort hhid: gen dup=cond(_N==1, 0, _n)
save hh_rv_18_19
infile using "F:\toshiba_PLFS\2018_19\PERfv_18_19.dct",clear
isid fsu samplesbno sssno shno prsn_srl
gen hhid=fsu+samplesbno+sssno+shno
gen psid=hhid+prsn_srl
save per_fv_18_19
infile using "F:\toshiba_PLFS\2018_19\PERrv_18_19.dct",clear
isid fsu samplesbno sssno shno prsn_srl visit
gen hhid=fsu+samplesbno+sssno+shno
gen psid=hhid+prsn_srl
save per_rv_18_19
use hh_fv_18_19,clear
merge 1:m hhid using per_fv_18_19
drop _merge
save hhind_fv_18_19
use hh_rv_18_19,clear
merge 1:m hhid visit using per_rv_18_19
drop _merge
save hhind_rv_18_19
*______Making Rotational Panel_2_______*
use hhind_fv_18_19,clear //use first visit HH and Individual merged file
gen panelid="P15" if quartr=="Q5" //create panel Id
replace panelid="P16" if quartr=="Q6"
replace panelid="P17" if quartr=="Q7"
replace panelid="P18" if quartr=="Q8"
***Give Prefix
foreach x of var * {
rename `x' fv_`x'
}
ren (fv_hhid fv_psid fv_panelid) (hhid psid panelid)
**Keep Urban Data Only
keep if fv_sect=="2"
save fv_18_19
use hhind_rv_18_19,clear
gen panelid="P14" if quartr=="Q5" & visit=="V2" //Generate Panel ID
replace panelid="P13" if quartr=="Q5" & visit=="V3"
replace panelid="P12" if quartr=="Q5" & visit=="V4"
replace panelid="P15" if quartr=="Q6" & visit=="V2"
replace panelid="P14" if quartr=="Q6" & visit=="V3"
replace panelid="P13" if quartr=="Q6" & visit=="V4"
replace panelid="P16" if quartr=="Q7" & visit=="V2"
replace panelid="P15" if quartr=="Q7" & visit=="V3"
replace panelid="P14" if quartr=="Q7" & visit=="V4"
replace panelid="P17" if quartr=="Q8" & visit=="V2"
replace panelid="P16" if quartr=="Q8" & visit=="V3"
replace panelid="P15" if quartr=="Q8" & visit=="V4"
**Give Prefix
foreach x of var * {
rename `x' rv_`x'
}
ren (rv_hhid rv_psid rv_panelid) (hhid psid panelid)
save rv_18_19
**Merge First Visit and Re-visit File
use fv_18_19,clear
merge 1:m panelid psid using rv_18_19
**Don't Run: It is output
Result # of obs.
_merge
panelid master on using onl Total P12 0 0 44,208 0 44,208 P13 0 88,880 0 88,880 P14 0 133,380 0 133,380 P15 776 836 131,739 133,351 P16 943 466 87,781 89,190 P17 9 149 45,825 45,983 P18 44,846 0 0 44,846 Total 46,574 267,919 265,345 579,838 save rotational_2_18_19 //This is the second file
********************Repeat above steps with 2019-2020 data**************************
**************2019-2020***********************
cd "F:\toshiba_PLFS\2019-2020"
infile using "F:\toshiba_PLFS\2019-2020\HHfv_19_20.dct",clear
isid fsu samplesbno sssno shno
gen hhid=fsu+samplesbno+sssno+shno
bysort hhid: gen dup=cond(_N==1, 0, _n)
save hh_fv_19_20
infile using "F:\toshiba_PLFS\2019-2020\HHrv_19_20.dct",clear
isid fsu samplesbno sssno shno visit
gen hhid=fsu+samplesbno+sssno+shno
bysort hhid: gen dup=cond(_N==1, 0, _n)
save hh_rv_19_20
infile using "F:\toshiba_PLFS\2019-2020\PERfv_19_20.dct",clear
isid fsu samplesbno sssno shno prsn_srl
gen hhid=fsu+samplesbno+sssno+shno
gen psid=hhid+prsn_srl
save per_fv_19_20
infile using "F:\toshiba_PLFS\2019-2020\PERrv_19_20.dct",clear
isid fsu samplesbno sssno shno prsn_srl visit
gen hhid=fsu+samplesbno+sssno+shno
gen psid=hhid+prsn_srl
save per_rv_19_20
use hh_fv_19_20,clear
merge 1:m hhid using per_fv_19_20
drop _merge
save hhind_fv_19_20
use hh_rv_19_20,clear
merge 1:m hhid visit using per_rv_19_20
drop _merge
save hhind_rv_19_20
*______Making Rotational Panel_3_______*
cd "F:\toshiba_PLFS\2019-2020"
use hhind_fv_19_20,clear
gen panelid="P21" if quartr=="Q1"
replace panelid="P22" if quartr=="Q2"
replace panelid="P23" if quartr=="Q3"
replace panelid="P24" if quartr=="Q4"
foreach x of var * {
rename `x' fv_`x'
}
ren (fv_hhid fv_psid fv_panelid) (hhid psid panelid)
keep if fv_sect=="2"
save fv_19_20
use hhind_rv_19_20,clear
gen panelid="P21" if quartr=="Q2" & visit=="V2"
replace panelid="P21" if quartr=="Q3" & visit=="V3"
replace panelid="P16" if quartr=="Q1" & visit=="V4"
replace panelid="P22" if quartr=="Q3" & visit=="V2"
replace panelid="P22" if quartr=="Q4" & visit=="V3"
replace panelid="P17" if quartr=="Q1" & visit=="V3"
replace panelid="P17" if quartr=="Q2" & visit=="V4"
replace panelid="P23" if quartr=="Q4" & visit=="V2"
replace panelid="P18" if quartr=="Q1" & visit=="V2"
replace panelid="P18" if quartr=="Q2" & visit=="V3"
replace panelid="P18" if quartr=="Q3" & visit=="V4"
foreach x of var * {
rename `x' rv_`x'
}
ren (rv_hhid rv_psid rv_panelid) (hhid psid panelid)
save rv_19_20
use fv_19_20,clear
merge 1:m panelid psid using rv_19_20
tab panelid _merge
_merge
panelid master on using onl Total P16 0 43,010 0 43,010 P17 0 89,508 0 89,508 P18 0 130,646 0 130,646 P21 429 943 130,537 131,909 P14 0 133,380 0 P22 977 392 86,438 87,807 P23 1,391 122 41,567 43,080 P24 44,447 0 0 44,447 Total 47,244 264,621 258,542 570,407 save rotational_3_19_20
*Creating Visit-wise Files. We can directly start combining visit-wise files from Step 1 as an alternative
cd "F:\Hard_Drive_Toshiba\toshiba_PLFS\2018_19"
use "rotational_2_18_19",clear
append using "F:\Hard_Drive_Toshiba\toshiba_PLFS\2019-2020\rotational_3_19_20.dta",
gen(_mmerge)
sort psid panelid rv_visit
bysort psid panelid: gen dup=cond(_N==1,0,_n)
br hhid psid panelid *_age dup *_visit
br hhid psid panelid *_age dup *_visit _mm
gen a="12" if panelid=="P12"
replace a="13" if panelid=="P13"
replace a="14" if panelid=="P14"
replace a="15" if panelid=="P15"
replace a="16" if panelid=="P16"
replace a="17" if panelid=="P17"
replace a="18" if panelid=="P18"
replace a="19" if panelid=="P19"
replace a="20" if panelid=="P20"
replace a="21" if panelid=="P21"
replace a="22" if panelid=="P22"
replace a="23" if panelid=="P23"
egen uniq_id=concat(psid a)
gen visit=rv_visit
replace visit=fv_visit if missing(visit)
isid uniq_id visit
save sample
use sample,clear
keep if fv_visit=="V1"
bysort uniq_id : gen dup2=cond(_N==1,0,_n)
tab dup2
keep if dup2<=1
isid uniq_id
renpfix fv_ V1_
drop rv_*
save sample_V1
use sample,clear
keep if rv_visit=="V2"
isid uniq_id
renpfix rv_ V2_
drop fv_*
save sample_V2
use sample,clear
keep if rv_visit=="V3"
isid uniq_id
renpfix rv_ V3_
drop fv_*
save sample_V3
use sample,clear
keep if rv_visit=="V4"
isid uniq_id
renpfix rv_ V4_
drop fv_*
save sample_V4
use sample_V1,clear
merge m:1 uniq_id using sample_V2, gen(_mV1)
br hhid psid panelid *_age *_visit *_quartr uniq_id _mV1
merge m:1 uniq_id using sample_V3, gen(_mV2)
br hhid psid panelid *_age *_visit *_quartr uniq_id _mV1 _mV2
merge m:1 uniq_id using sample_V4, gen(_mV3)
br hhid psid panelid *_age *_visit *_quartr uniq_id _mV1 _mV2 _mV3
isid uniq_id
drop V1_dup dup2 V2_dup V3_dup V4_dup visit
save final_rot_1819_1920
****Cross-Check
sort panelid
br hhid psid panelid *_age *_visit *_quartr uniq_id _mV1 _mV2 _mV3
*P12 should have V1, V2 and V3 missing because their data is in 2017-18
*P13 should have V1 and V2 missing because their data is in 2017-18
*P14 should have V1 missing because their data is in 2017-18
*P15, P16, P17 and P18 should have values for all visits (V1, V2, V3, V4)
*P21 also should have values for all visits (V1, V2, V3, V4)
*P22 should have V4 missing because their data is in 2020-21. We do not consider PLFS-2020-21. You can extend.
*P23 should have V3 and V4 missing because their data is in 2020-21. We do not consider PLFS-2020-21. You can extend.
*P22 should have V2, V3 and V4 missing because their data is in 2020-21. We do not consider PLFS-2020-21. You can extend.
************************Codes End Here******************************************
References
Abdul-Razak, S., & Sahoo, S. (2021). Using the rotational panel data from the Periodic Labour Force Survey: A cautionary tale. Available at SSRN 3932499
Events
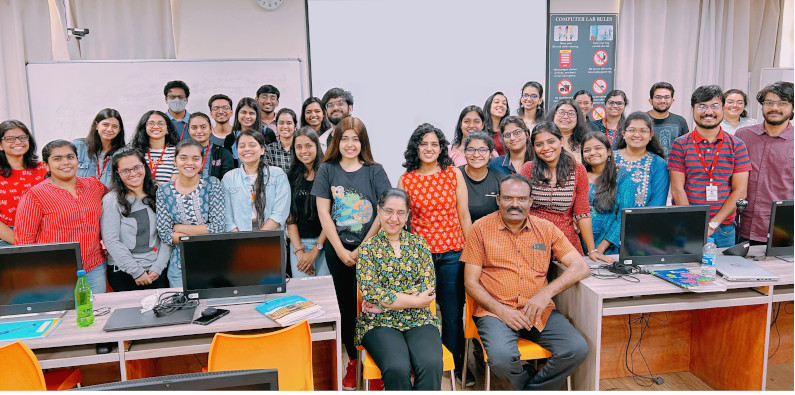
• In collaboration with The Indian Econometric Society (TIES), a workshop on Time Series Econometrics took place from March 20 to 23, 2023. Professor Ramachandran, an esteemed Economics professor from Pondicherry University, played a crucial role as a resource person during this event.
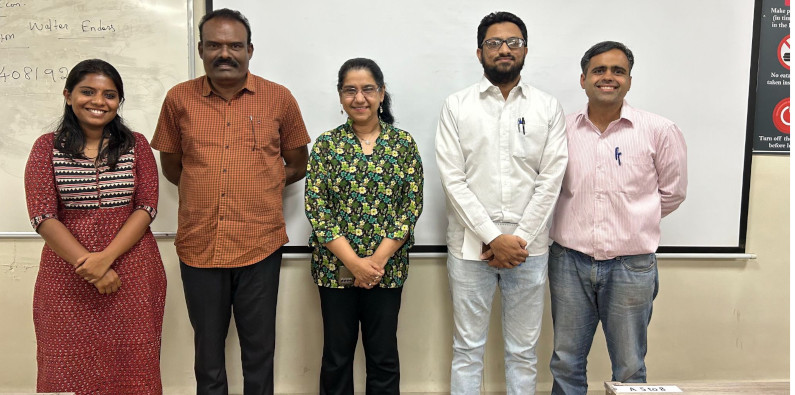
• On Jan 08, 2024 Mr Inder Majumdar, Ph.D. Scholar from the University of Wisconsin Urbana, IL, delivered a research talk on "Examining the Accuracy of Indian Inflation Estimates: Evidence from Engel Curves”. This event was jointly organized by CQLA and QIC.
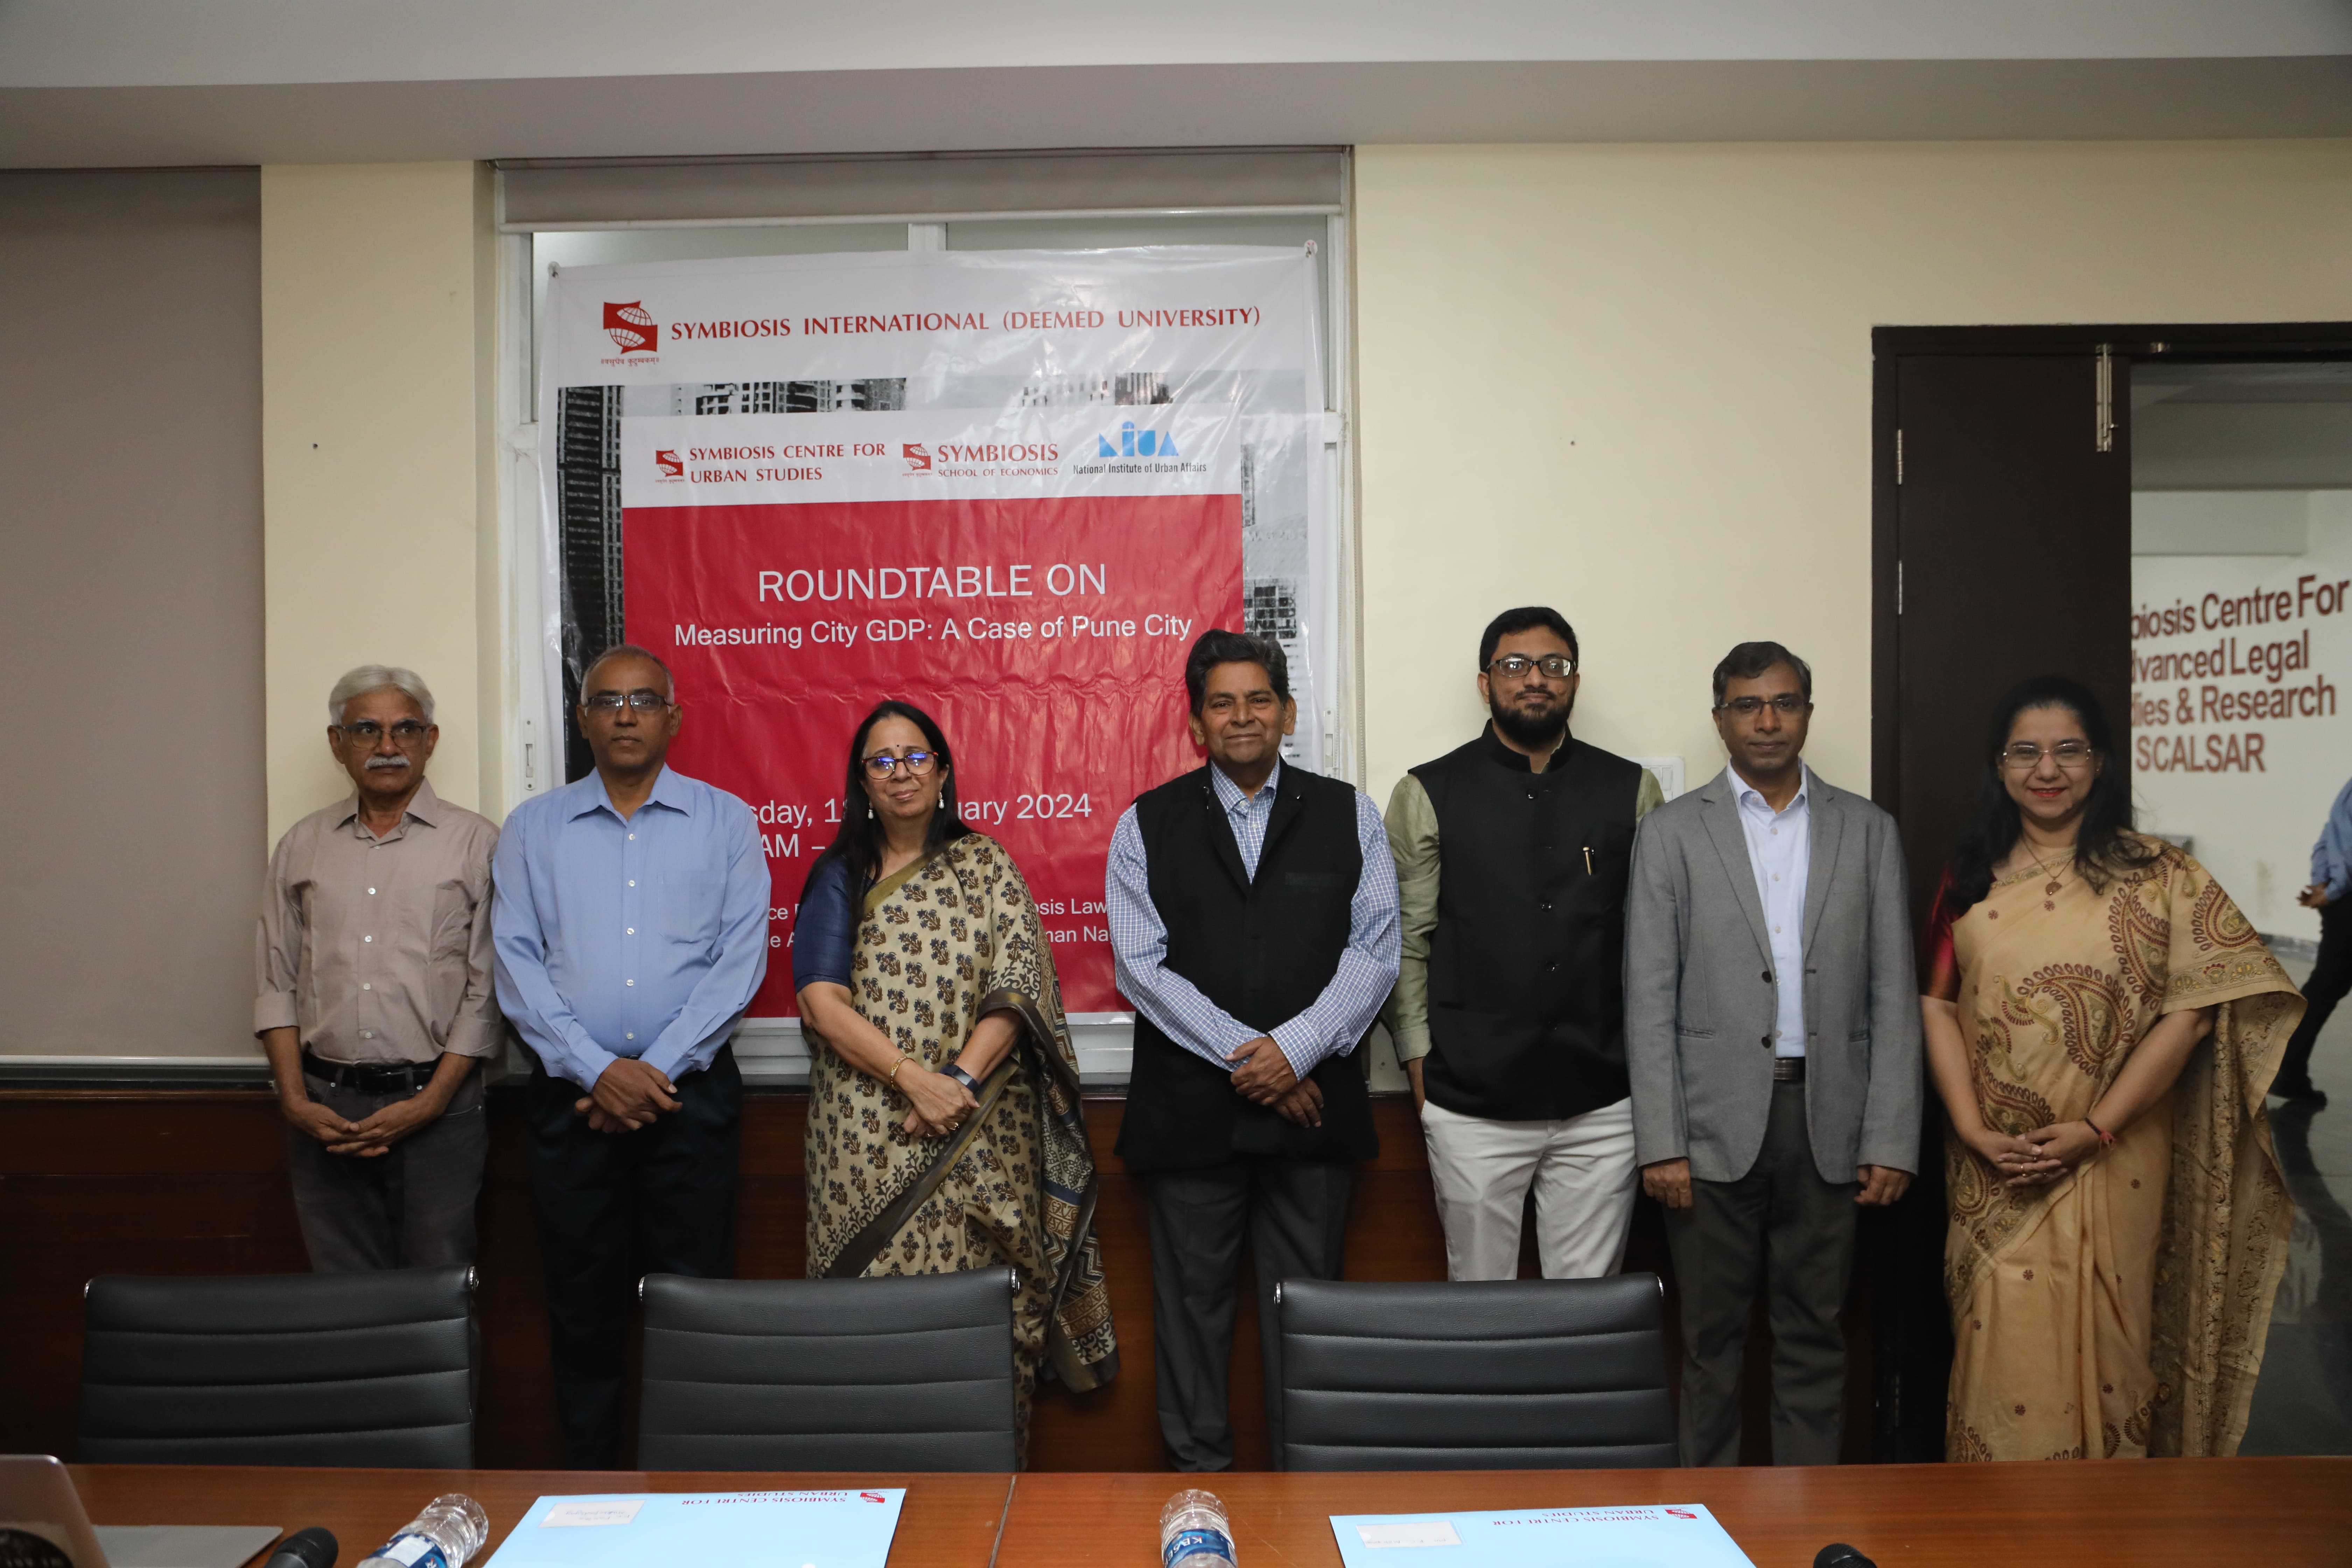
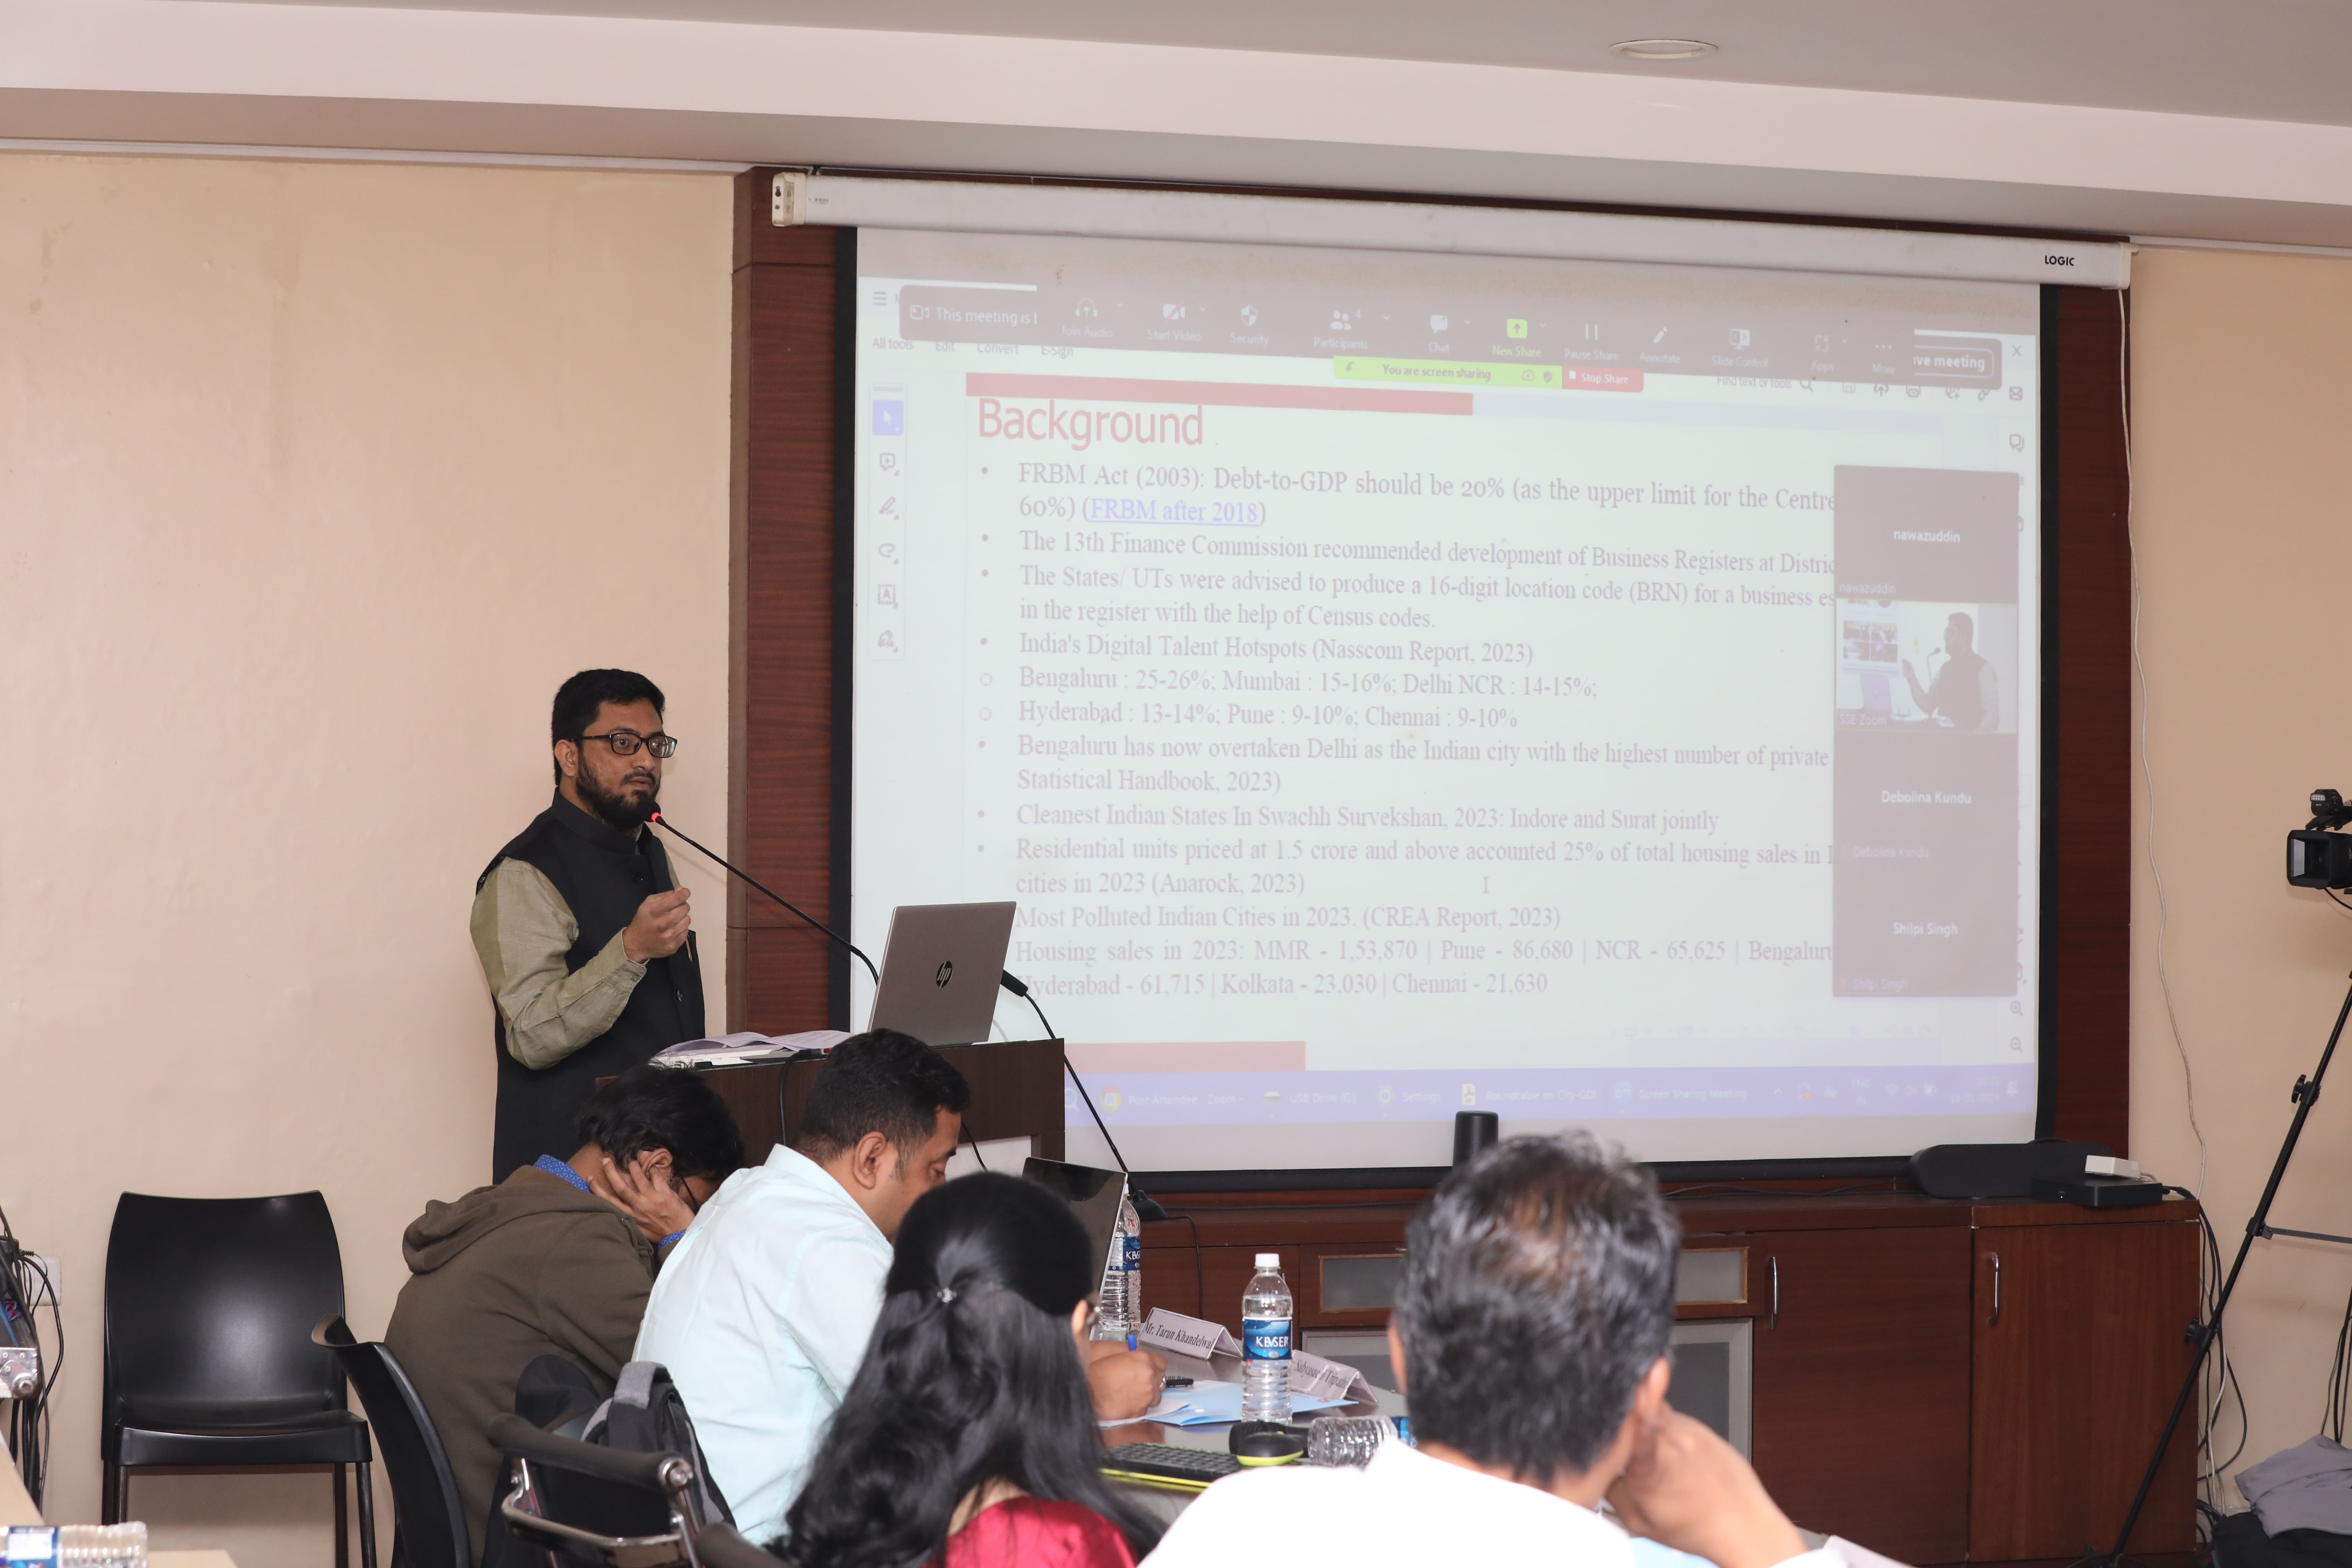
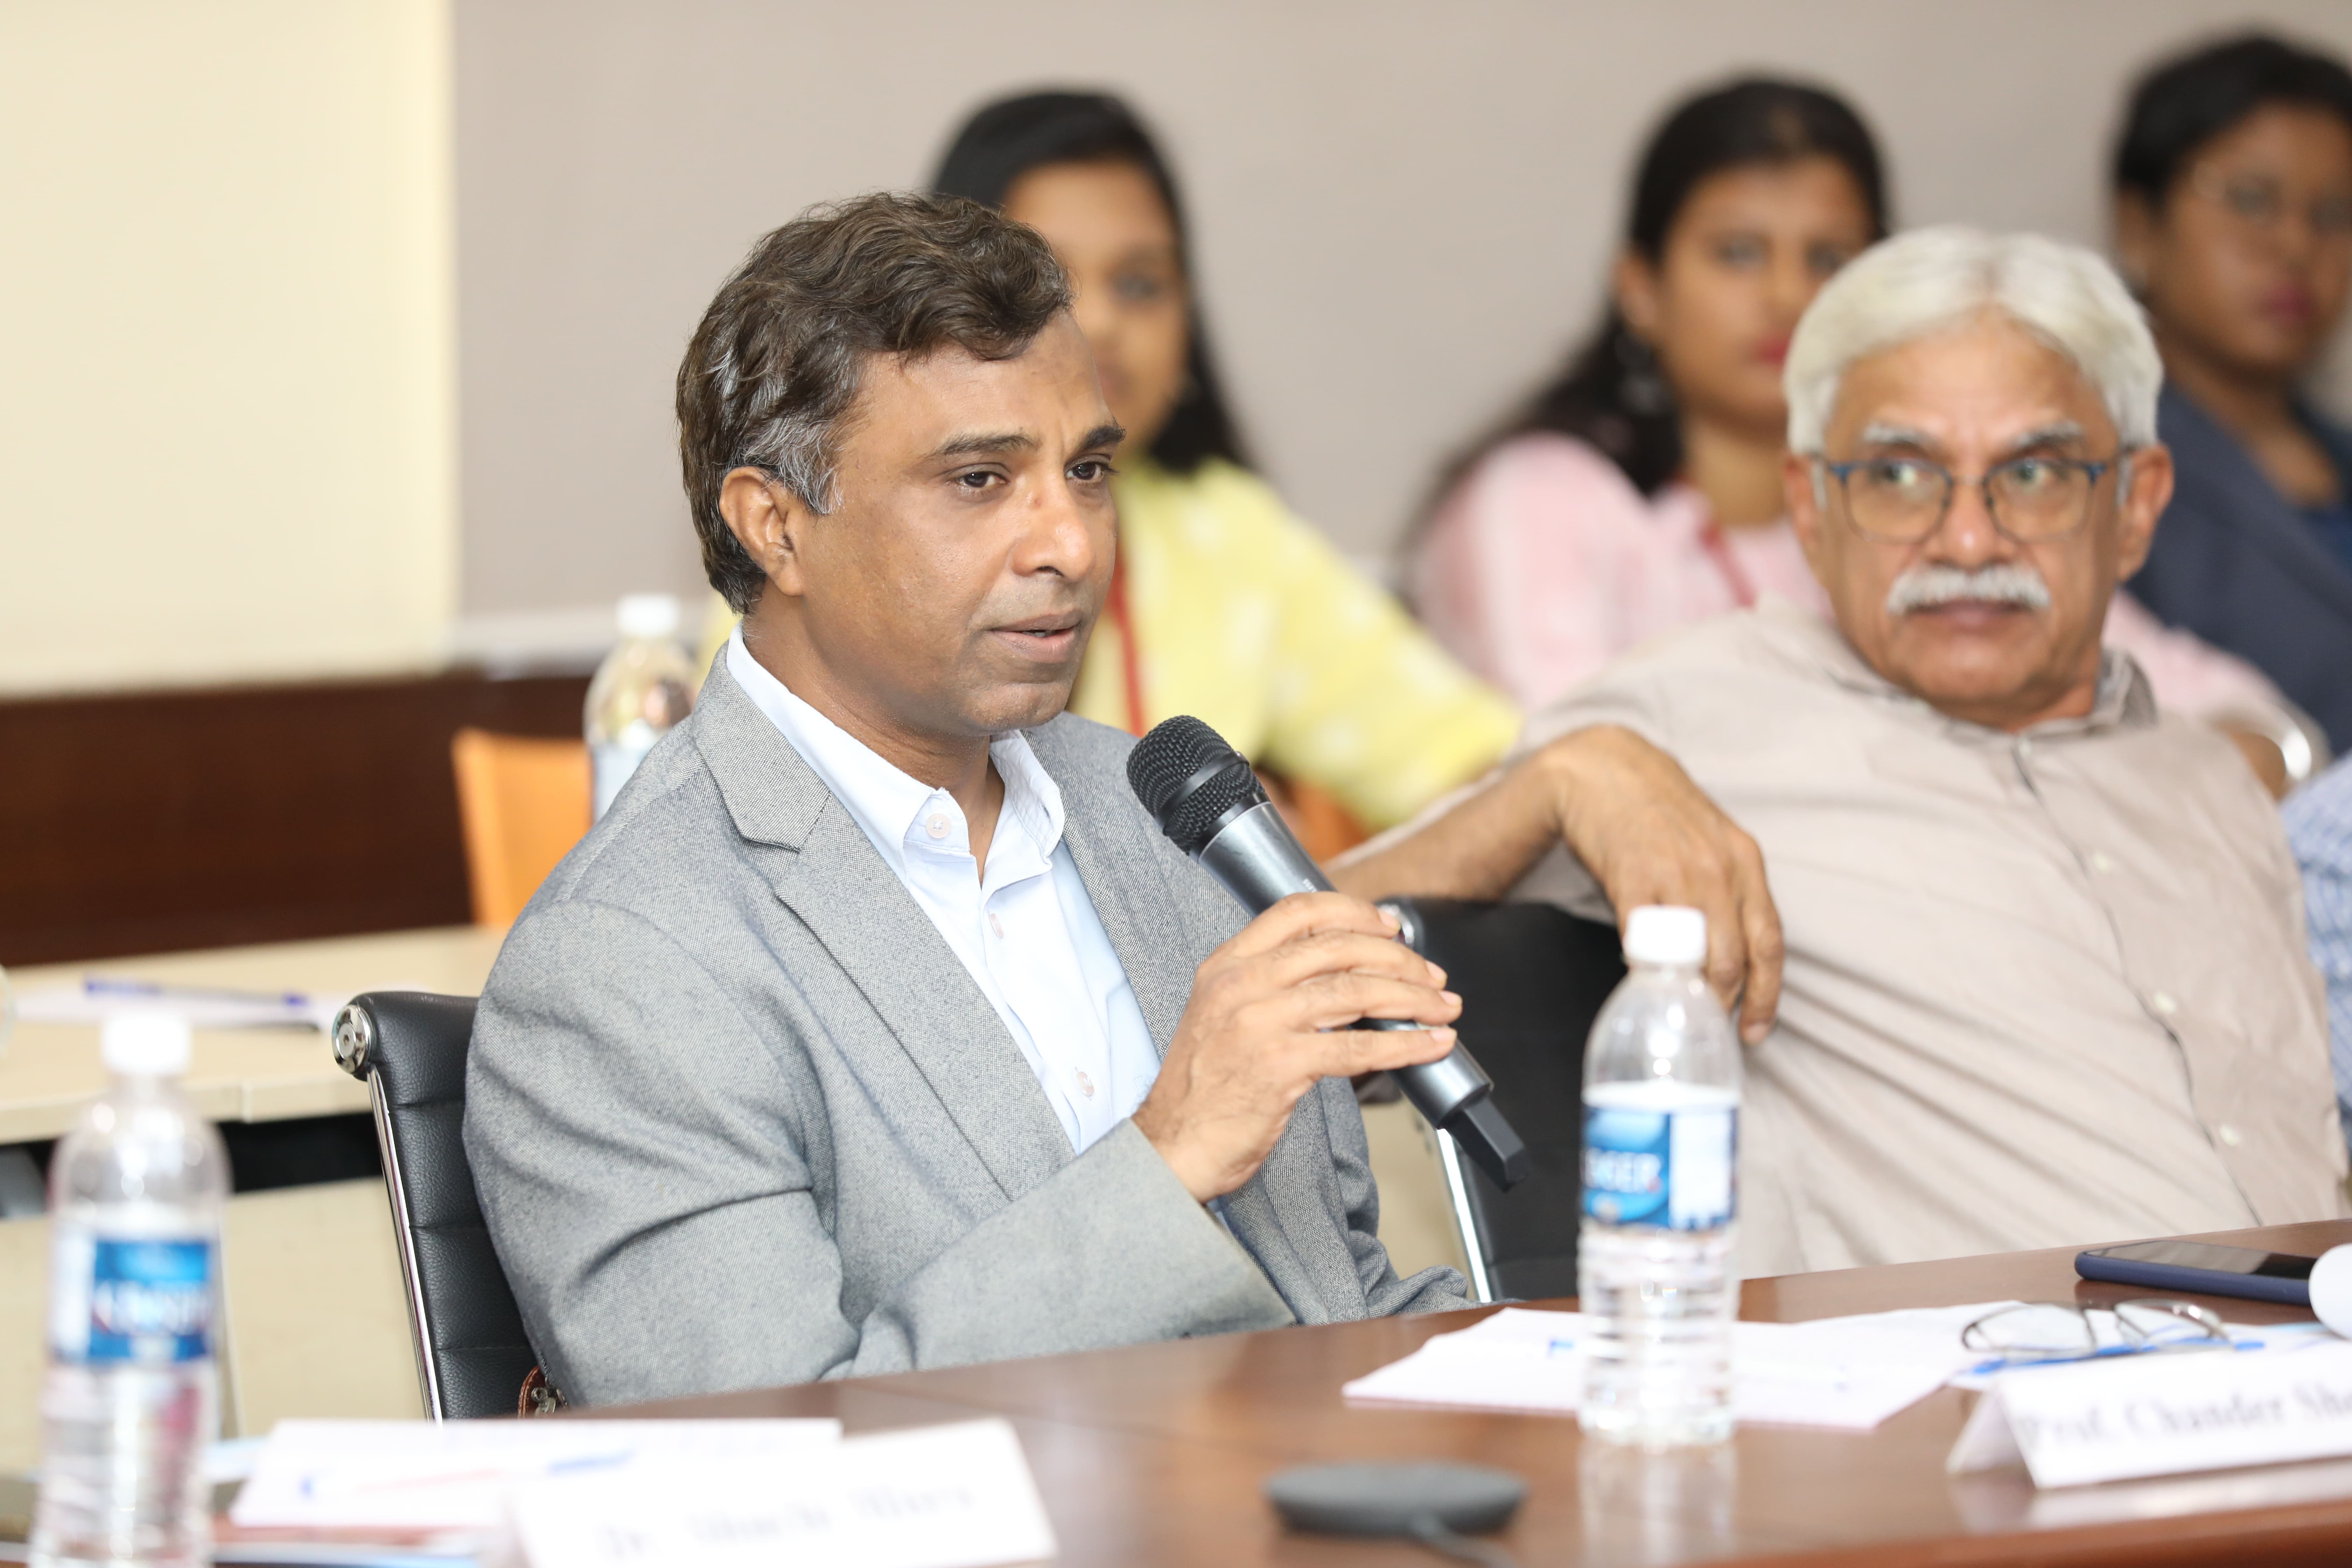
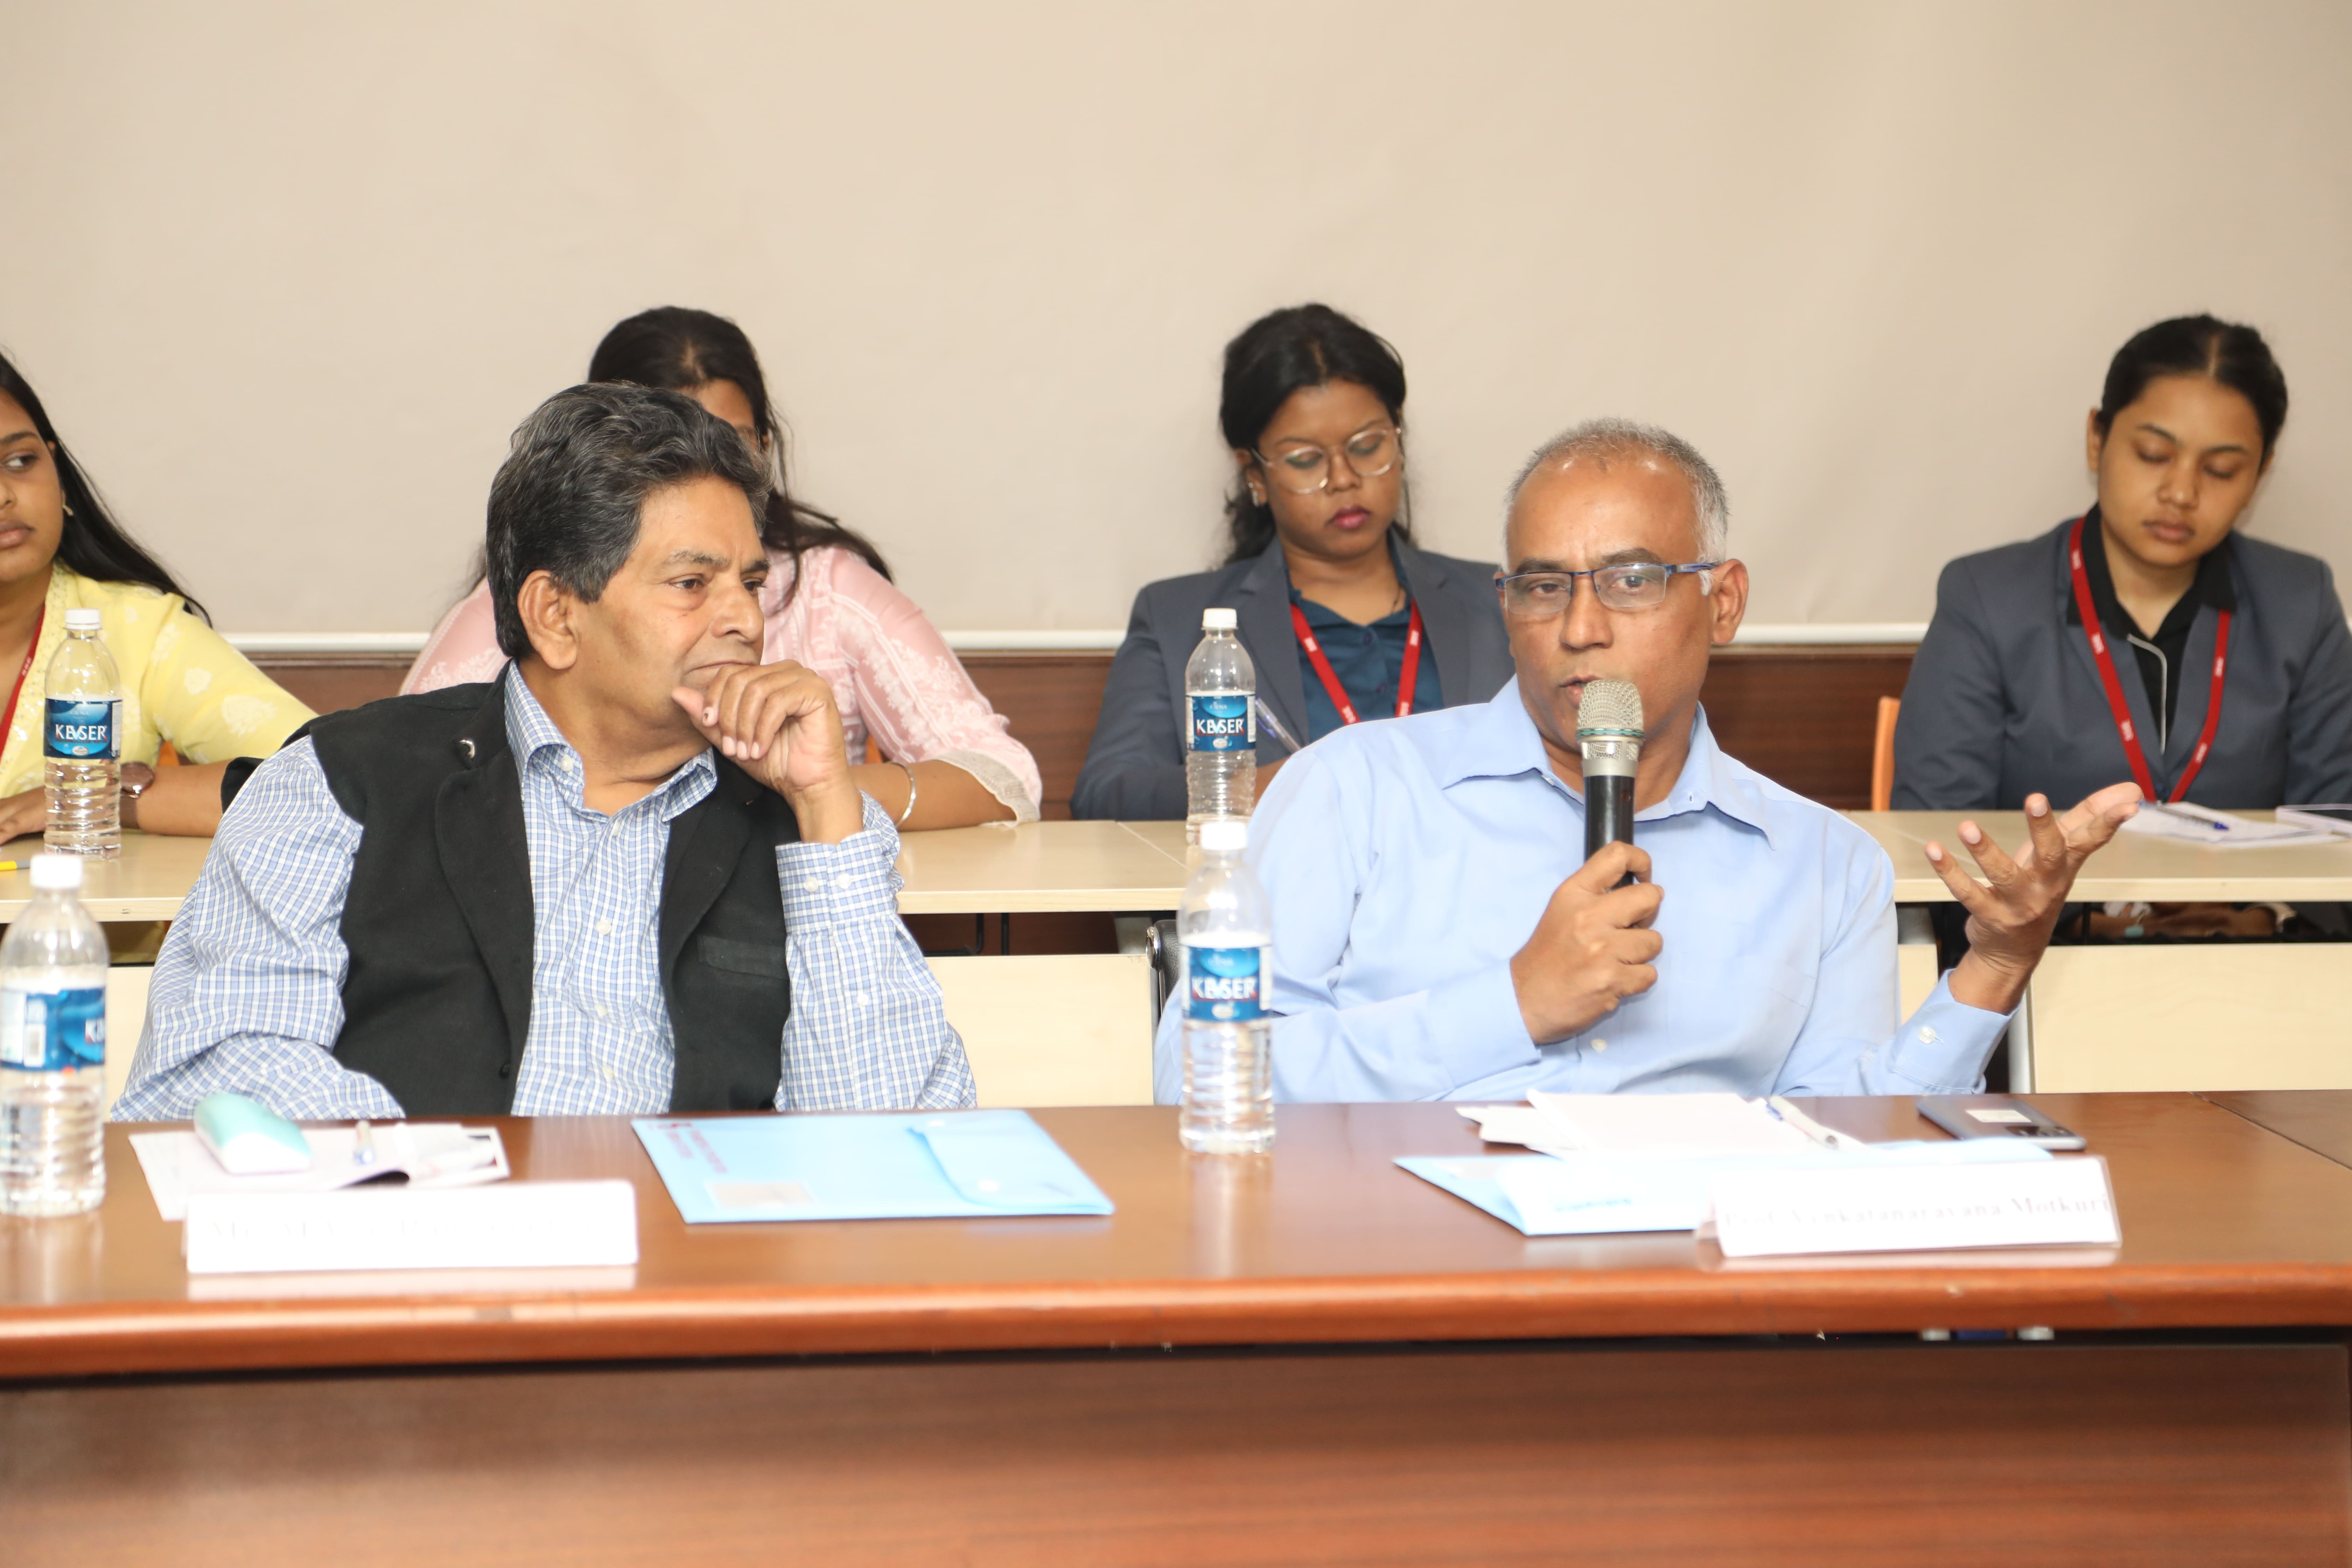
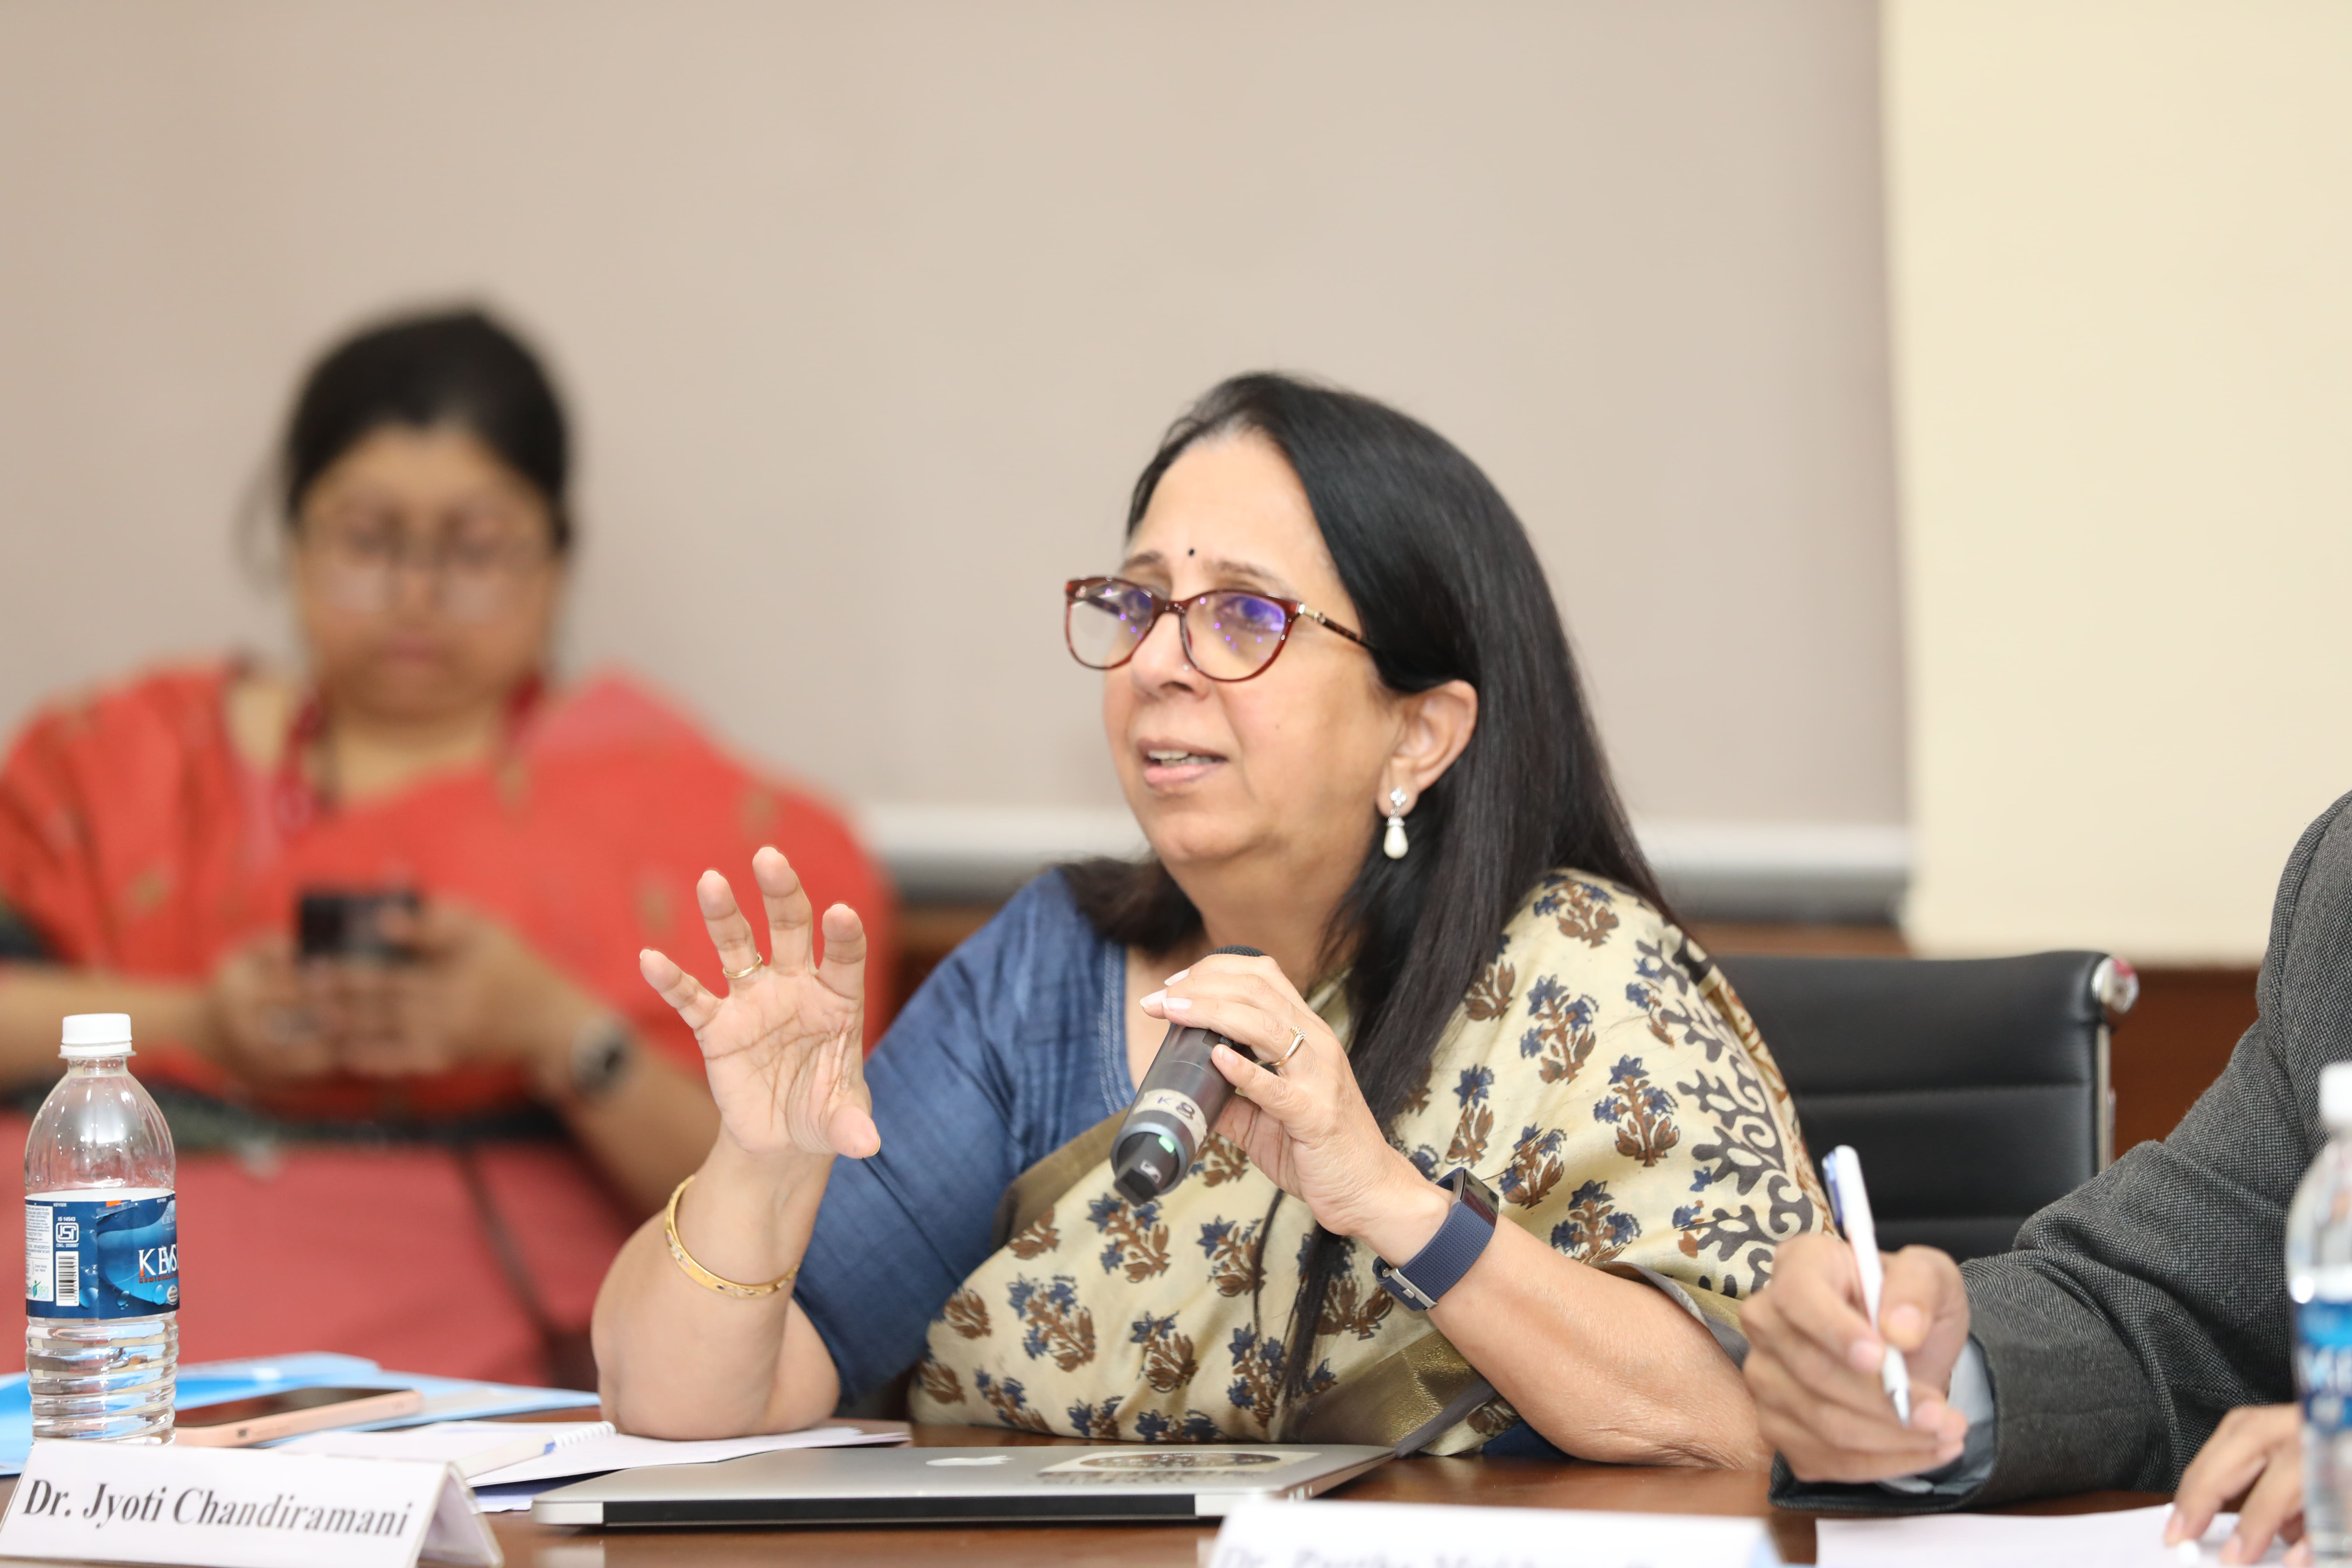
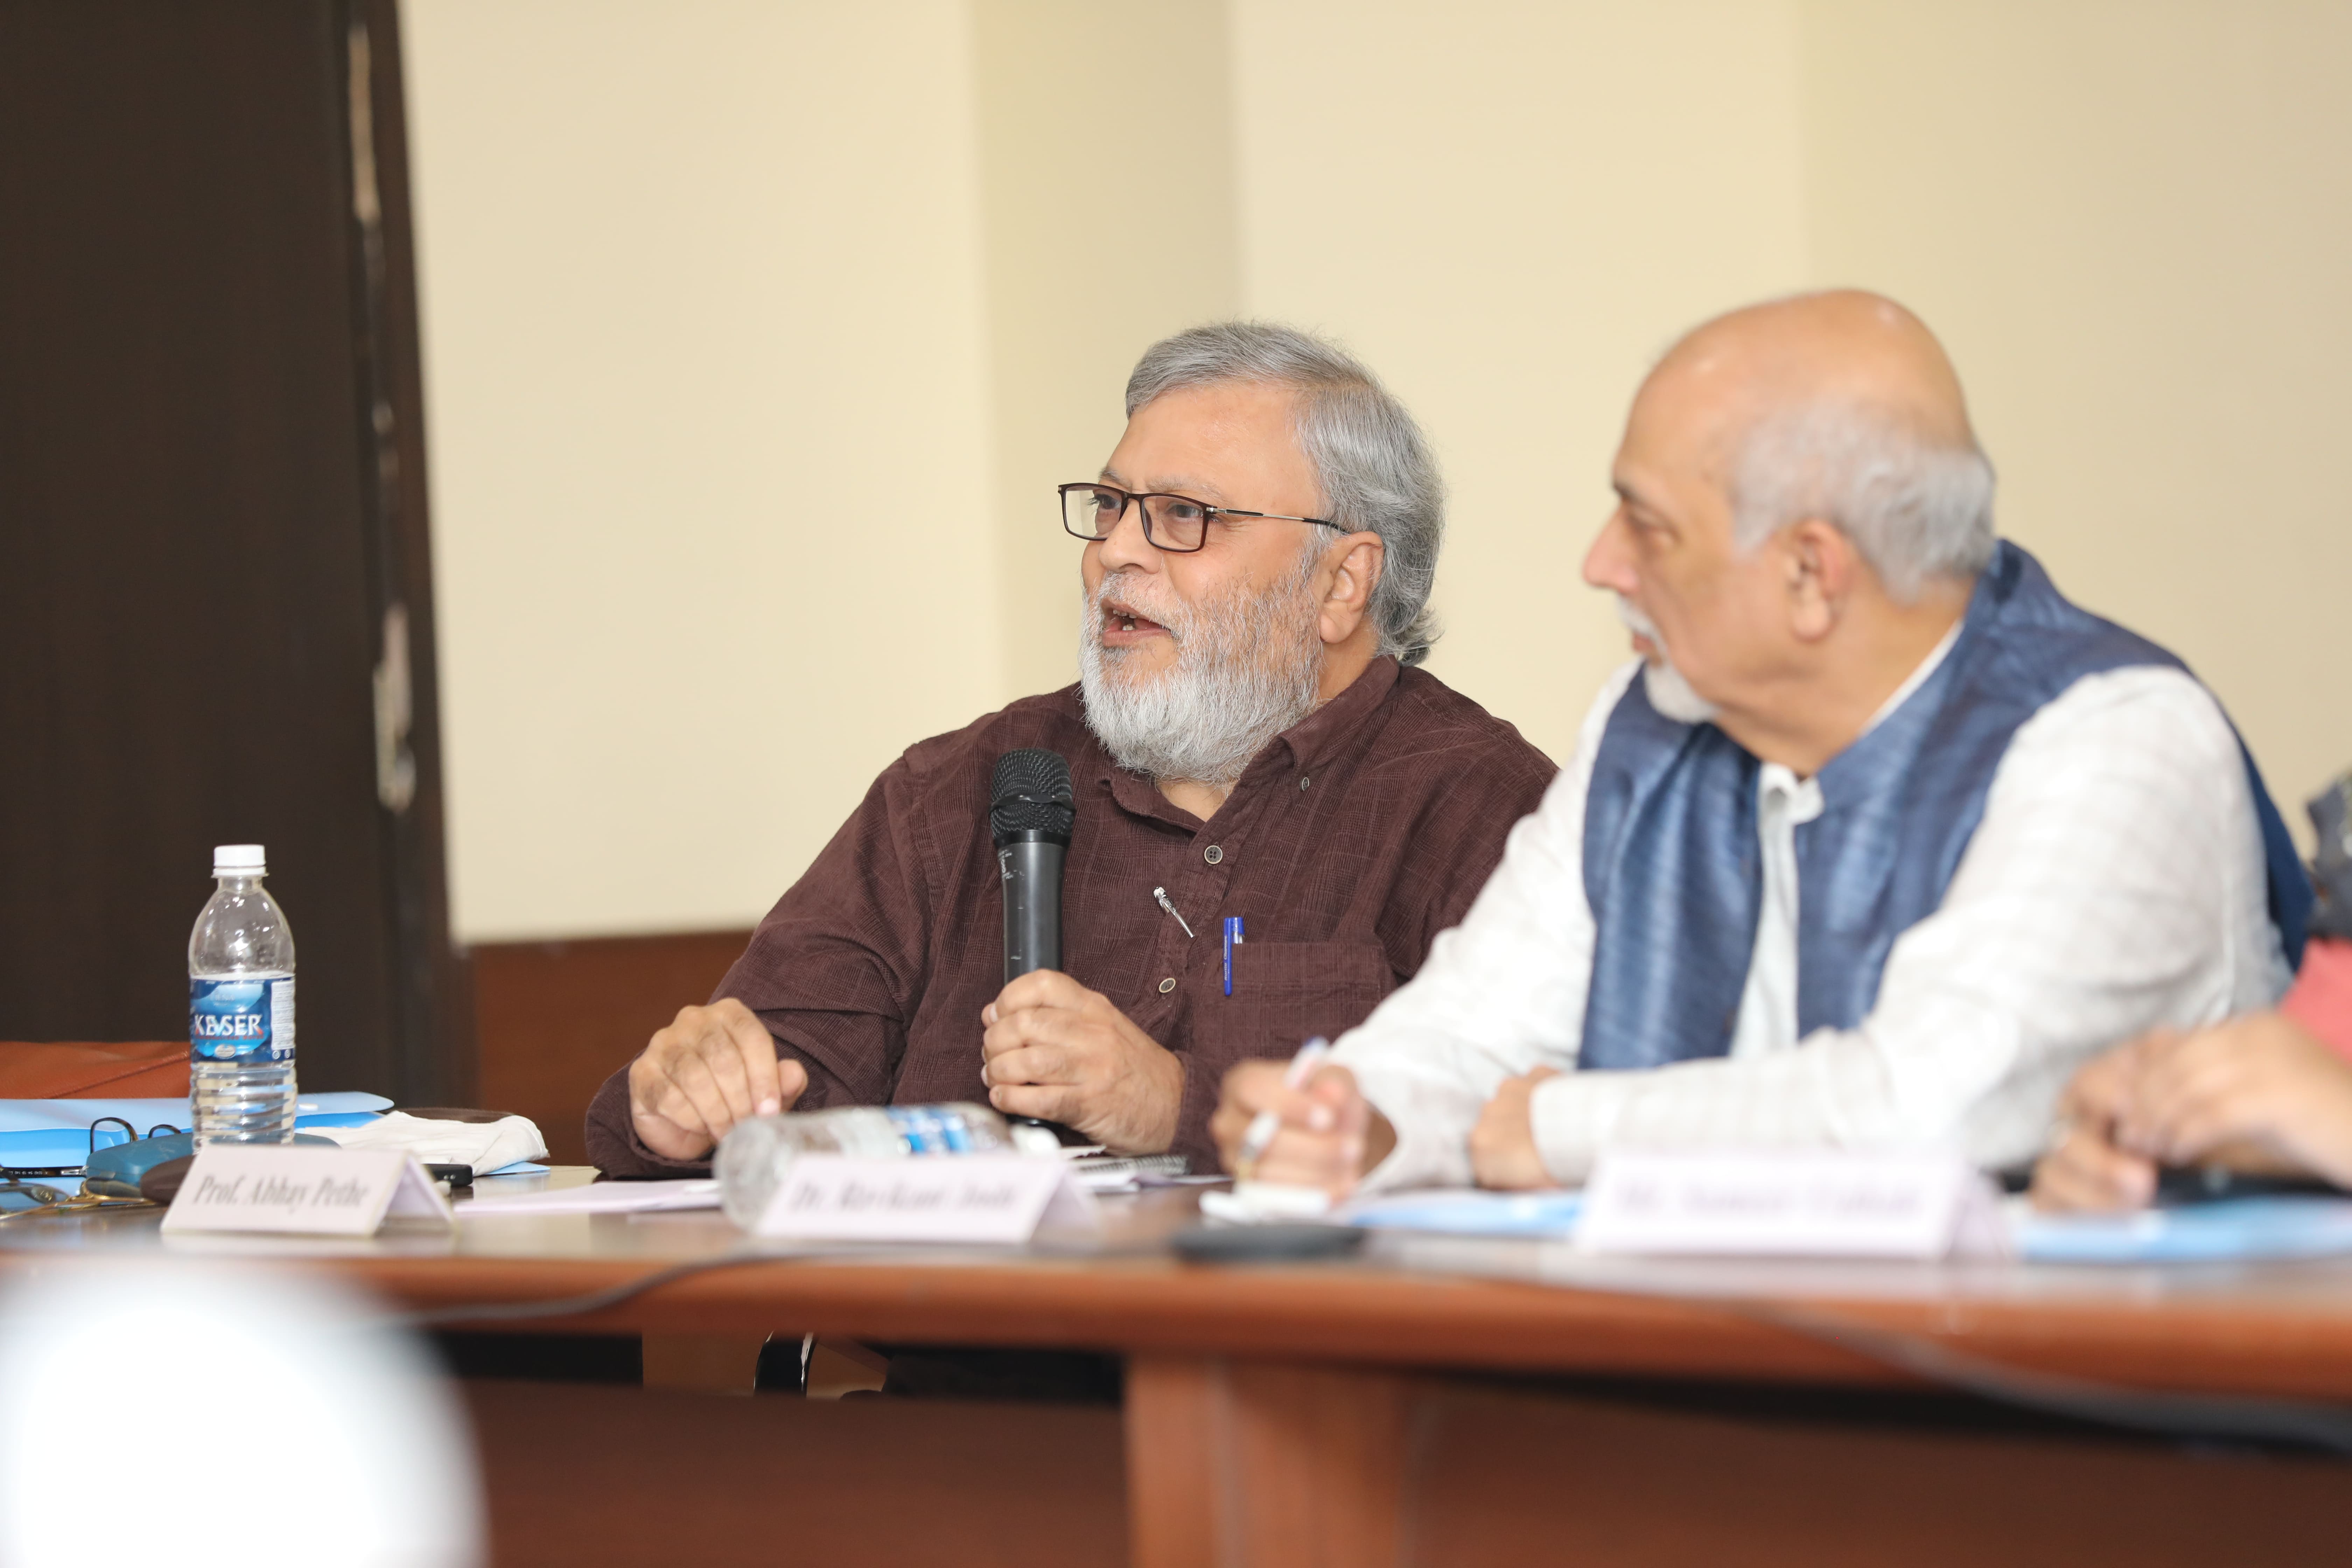
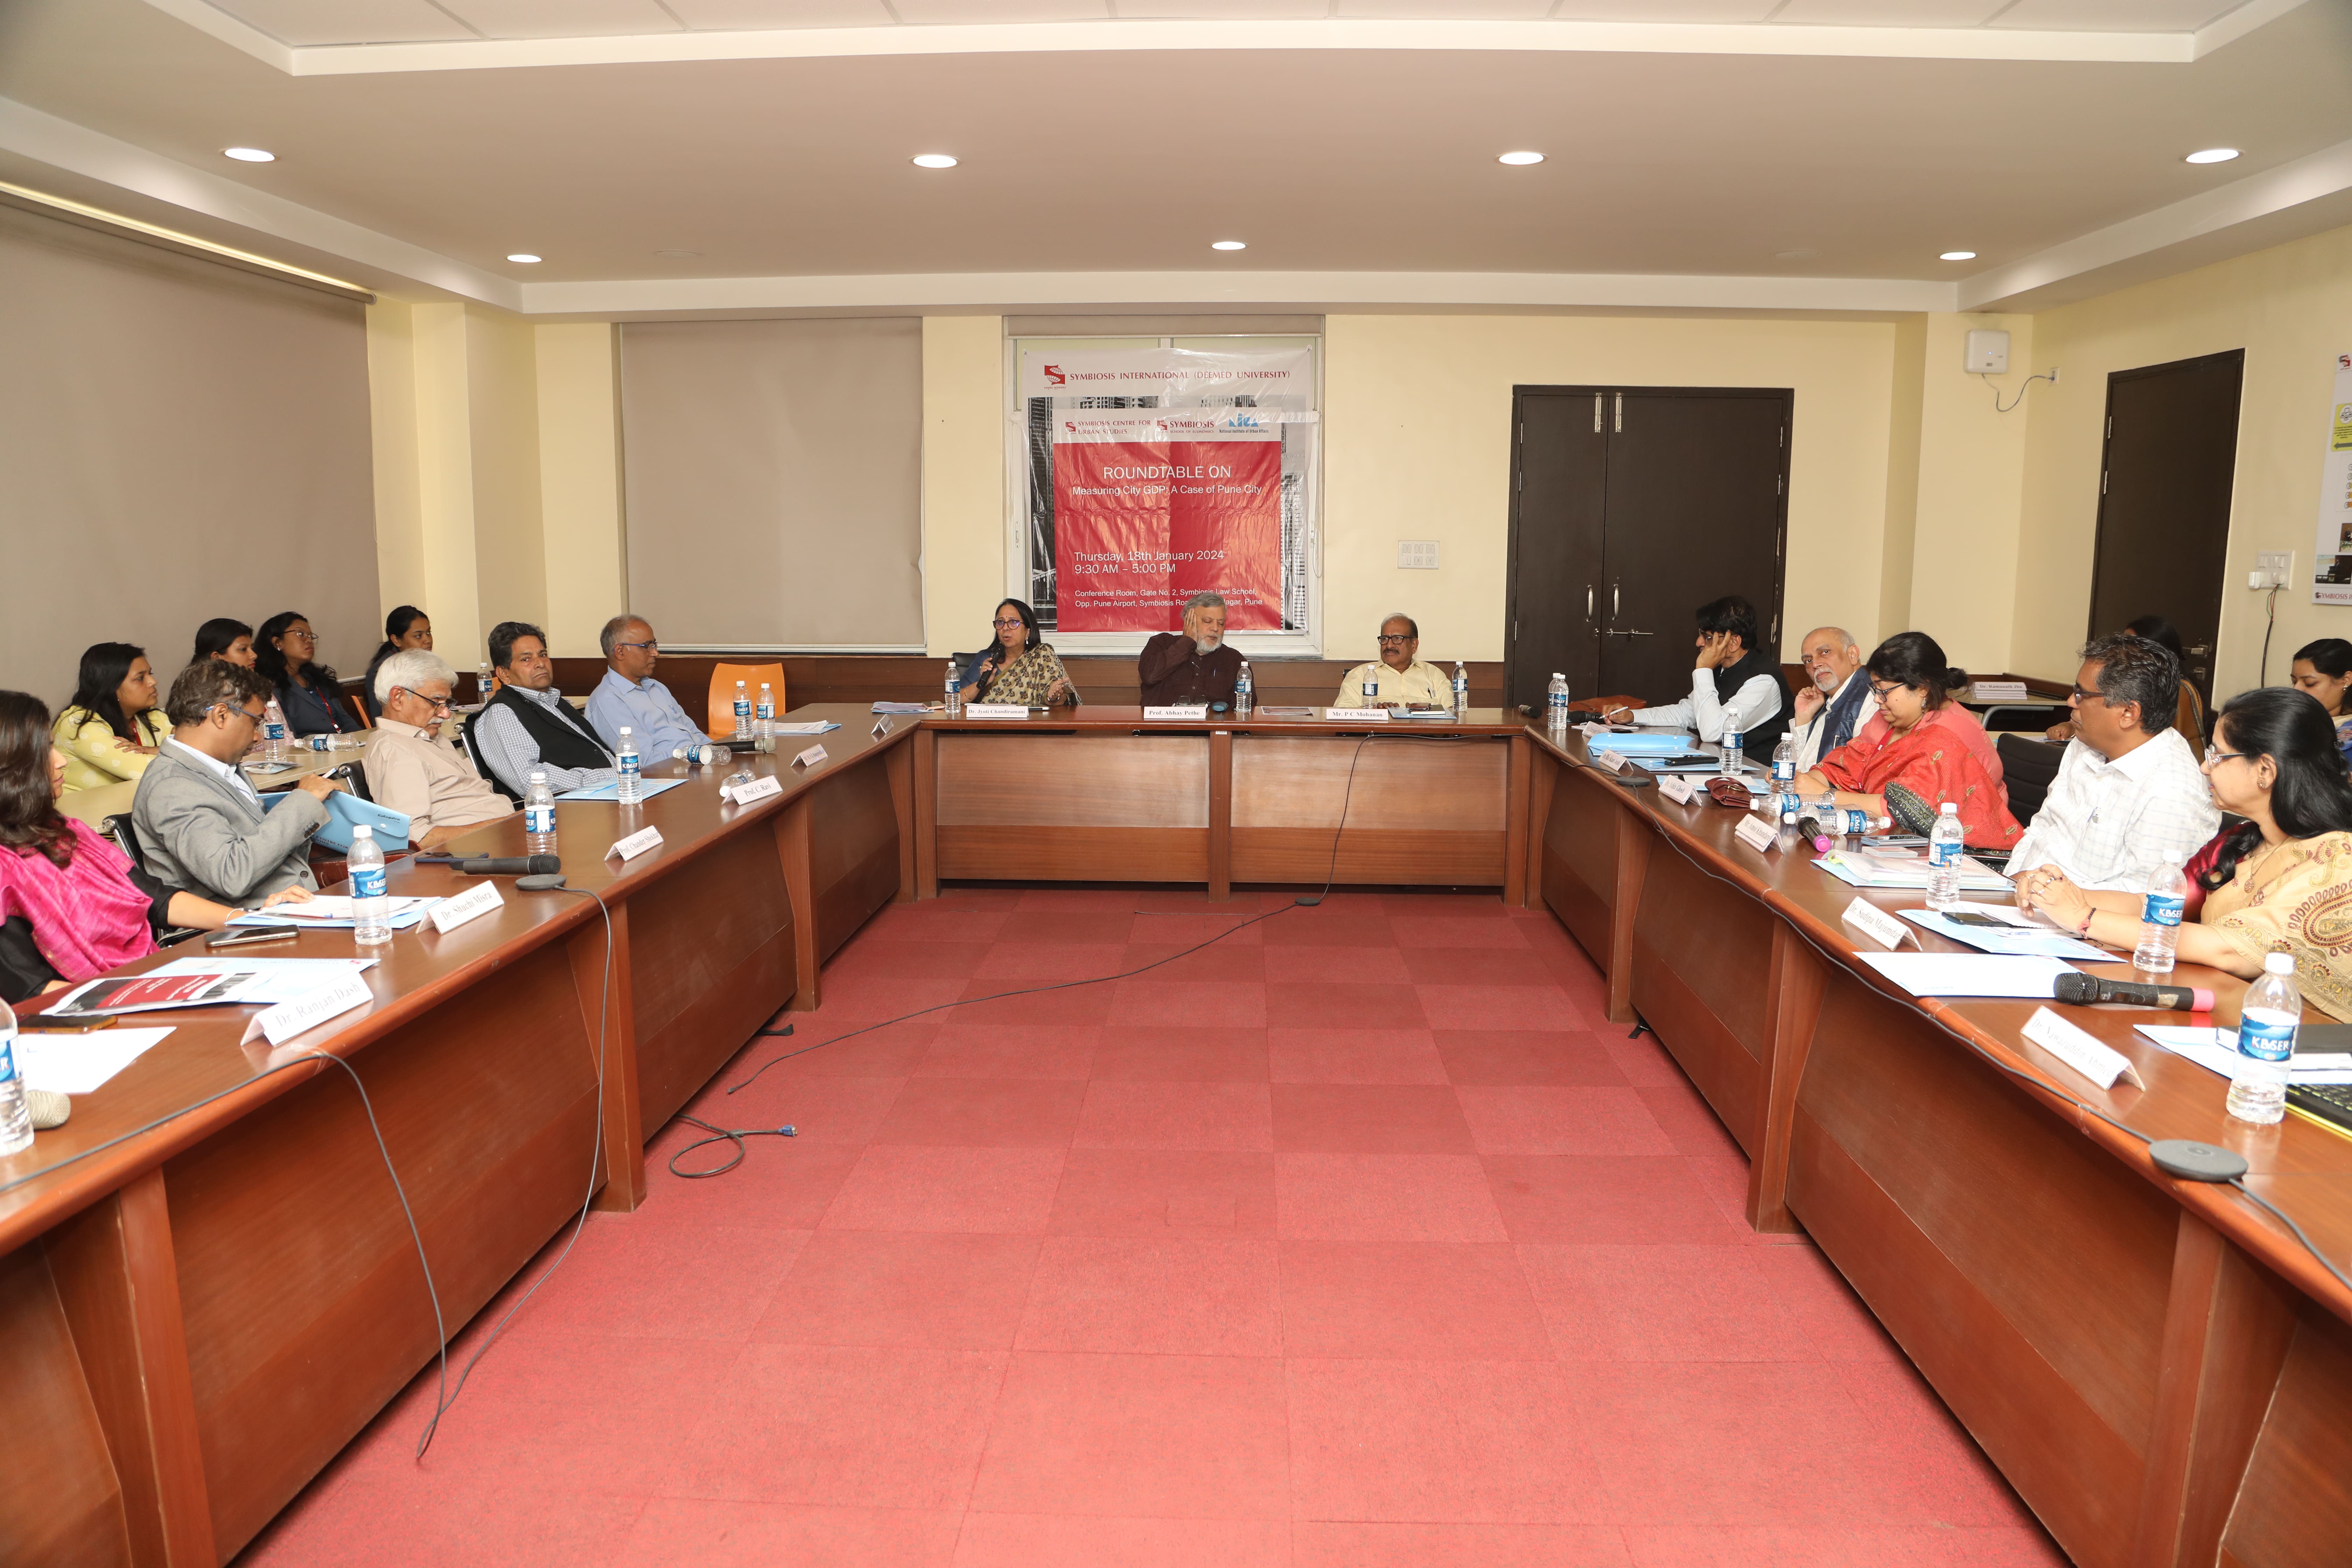
• Symbiosis School of Economics, in collaboration with the Symbiosis Centre for Urban Studies and the National Institute of Urban Affairs (NIUA), organized a round table discussion addressing the subject "Measuring City-GDP: A Case Study of Pune City." Notable experts in urban studies, data analysis, and individuals closely associated with the Indian Statistical System actively joined the discussion, contributing their valuable insights and perspectives.
- Conference